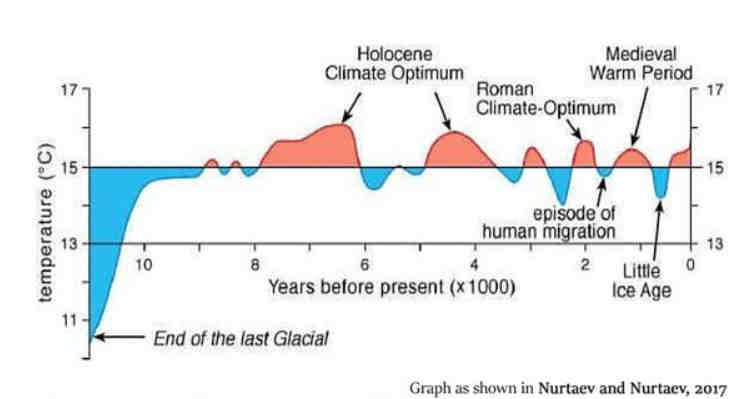
Over the last 8,000 years, the atmospheric CO2 concentration has risen steadily, while the average global temperature has declined. This fact contradicts the claim that CO2 is the main "global warming" control knob.
More on the relation between CO2 and temperature: Temperature versus CO2 – the big picture.
CO2 is a greenhouse gas, but it's warming capability is almost saturated. Even at much lower concentrations, it absorbs almost all energy that is emitted in its absorption wavelength bands, so adding more CO2 to the atmosphere has no measurable effect on global temperatures.
More in the role of CO2 as a greenhouse gas: Why did the warming stop?
Today's featured climate-related words from Vocaplus
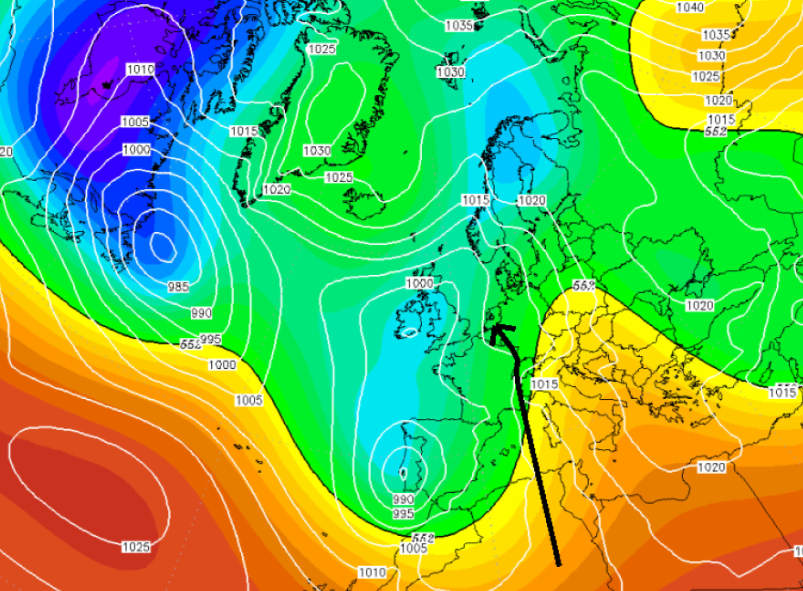
In the Netherlands, the day-to-day whether depends heavily on the direction the wind is coming from. Being a small country, the wind direction is quite homogeneous for the whole country, specially on higher altitudes where the bulk of heat convection is taking place.
Due to its geographical position, midway between the icy-cold Arctic to the north, the dry and hot Sahara to the south, the Eurasian land-mass to the east and the Atlantic Ocean to the west, every wind direction comes with unique weather characteristics.
North - cold,
East - dry,
South - warm,
West - wet whether. Read more...
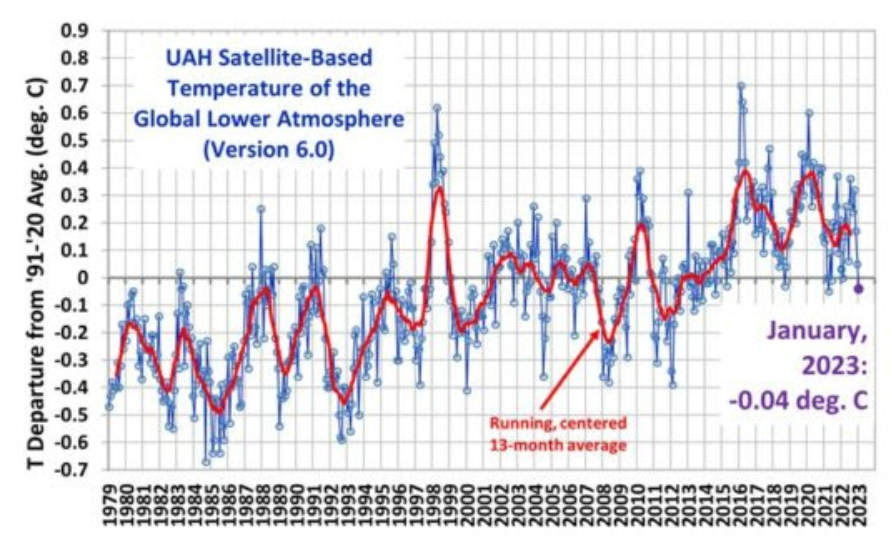
This month of January 2023, the average satellite temperature published, by Dr. Christy and Dr. Spencer (University Alabama Huntsfield) had a negative deviation, compared with the average monthly measures between 1991 and 2000.
Of course, this value does not mean much, it's definition is full of arbitrary begin and endpoints, but anyway it doesn't sound like a lot of warming has taken place over the past 30 years, and even less "catastrophic warming" we're reading about in the Mainstream Media, newspapers and TV stations. Read more...
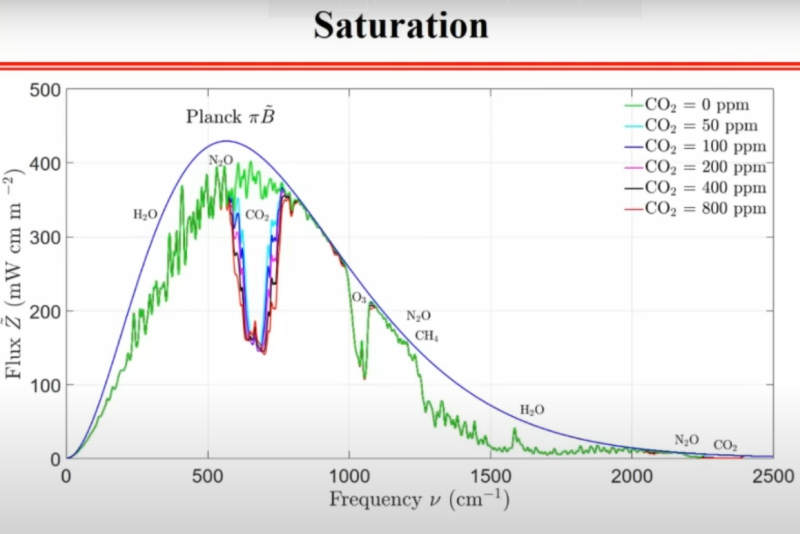
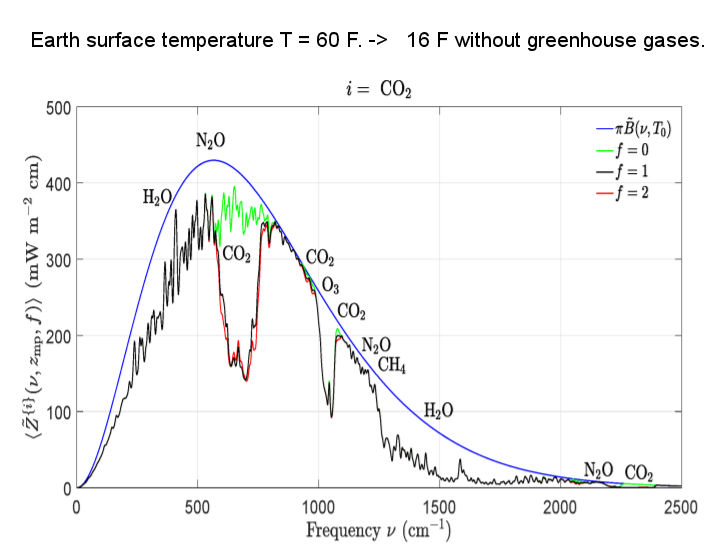
This graph is all you need to understand that CO2 is not the Earth's Climate Control Knob.
On the horizontal axis, we see the Infra-red (IR) spectrum wavelengths, that is like "IR colors" were this kind of radiation visible to the human eye.
The vertical axis shows to energy flux, that is the energy emitted by the Earth, as seen from outer space.
The graph itself shows how the Earth's atmosphere filters the IR radiation emitted by the Earth's surface and the role of the various greenhouse gases in that filtering process. The green line is the filter of the Earth's atmosphere without any greenhouse gases. Read more...
The climate has shown many fluctuations during the Holocene. The difference between the highest and lowest average temperature of the past 10 thousand years is about 3 °C.
Climate alarmists, led by the IPCC, are trying to deny this, and understandably so. This variation means that without human influence there was climate change as well.
This undermines their hypotheses and often their jobs depend on it.
Climate change seen from a historical perspective. Read more...
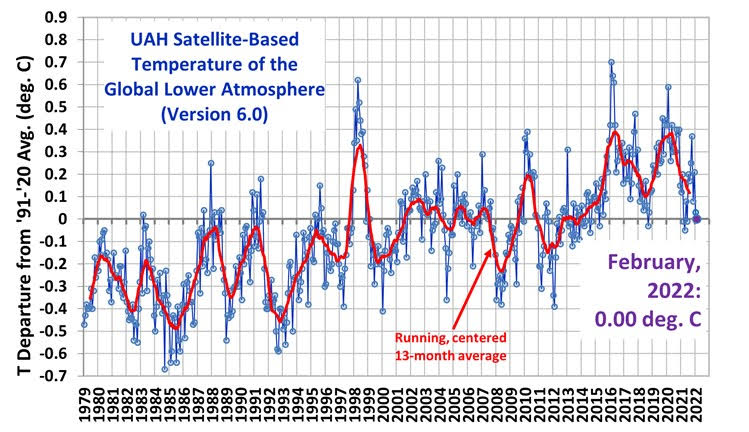
The satellite temperature departure measurement for February 2022 is exactly 0° C.
This means that Earth temperature during February 2022 was exactly the same as the average from 1991 to 2020.
Satellites are the best way to have insight into the short-term temperature variations. They measure the whole surface, independent of weather station distribution, Heat Islands, measurement failures, surface condition (land or water).
There is a step-wise increase in temperature, triggered by two very strong El Niño events (1998 and 2016.) The energy that welled up from the deep oceans established a new level in these two ocasions, where the warming paused. This is a natural phenomenon and has nothing to do with CO2, or human activity.
Where is the Climate Emergency? It just does not exist.
Wake up and spread this information to your government!
The IPCC's CO2 hypothesis, with which Western governments try to incite their citizens to group-think, panic and unnecessary measures and taxes, rests in large part on the belief that there is a positive feedback effect between the greenhouse effects of CO2 and water vapor (H2O). A small increase in temperature, caused by the increase in CO2 concentration, would lead to an increase in water vapor concentration and thus increase the H2O greenhouse effect.
This is a misconception. First, positive feedback effects are extremely rare in nature. Furthermore, there is no sensible word to say about the effect that an increase in the H2O greenhouse effect has on the temperature.
Below are three reasons why it is impossible to model this effect. Read more...
Rob Jetten is the new, brand new Minister of Climate and Energy in the Dutch cabinet Rutte IV.
This is a new ministry, but unfortunately it is characterized by the same ideas as in previous cabinets. The idea that humans, by burning fossil fuels, are responsible for the recent warming of the Earth. Read more...
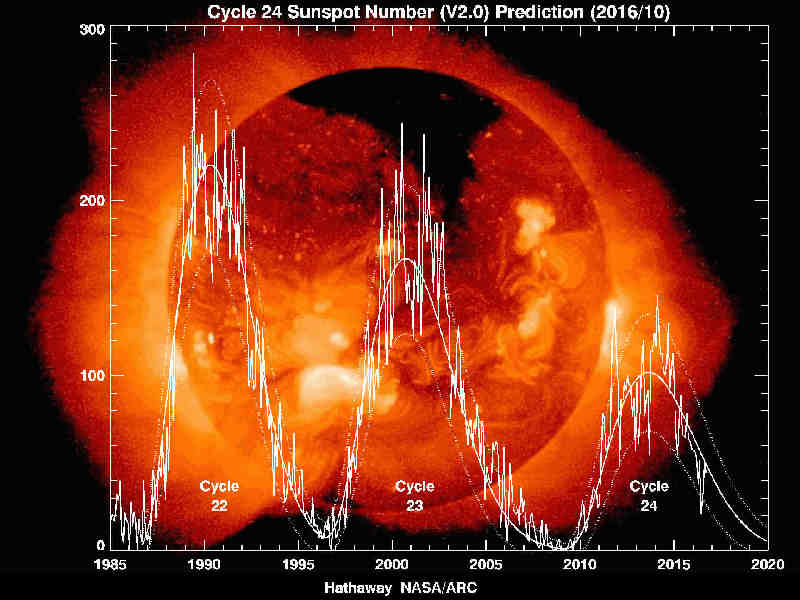
This article is partly based on the thorough research done by Freek van Leeuwen on the scientists Valentina Zharkova and Willie Soon and their work on sunspots.
Good news, then, but then the question arises where the heating comes from, which many people feel and which can also be seen in the monthly charts of the satellite measurements. Read more...
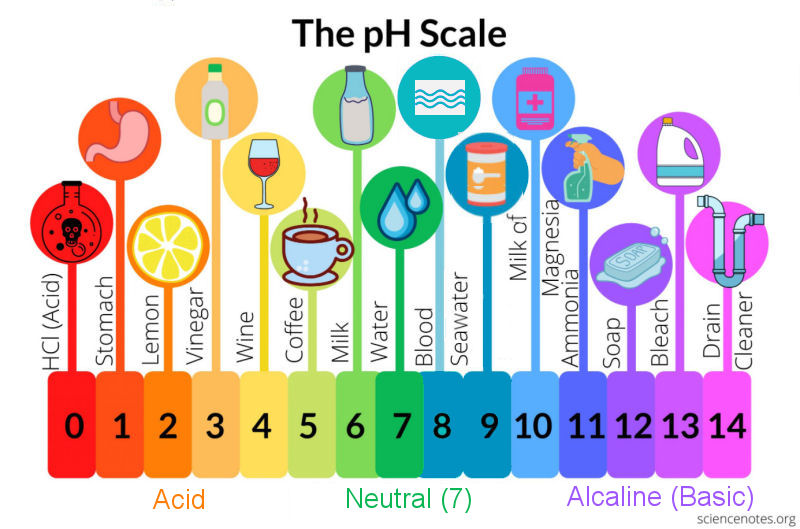
Beside Global Warming, the second scare governments all around the world are trying to make us believe is that man-made CO2 emissions are causing ocean acidification, that will have a severe impact on all ocean life. A related issue is coral bleaching, a process that is supposed to threaten unique ecosystems like the Great Barrier Reef. Read more...
In recent years, a very worrying situation has arisen regarding the climate issue. Western politicians seem to have lost touch with reality and are trying to outdo each other in political correctness, which is in no way supported by science. Scientists are silent for fear of losing their reputation and job.
The time seems to have come to put things straight. Read more...
We saw in an earlier article, "The fingerprints of the greenhouse effect", that IR measurements in the upper atmosphere indicate that the enhanced greenhouse effect is not occurring.
New research now proves that the human contribution to the increase in CO2 concentration cannot be more than 12%. The remaining 88% has natural causes. Read more...
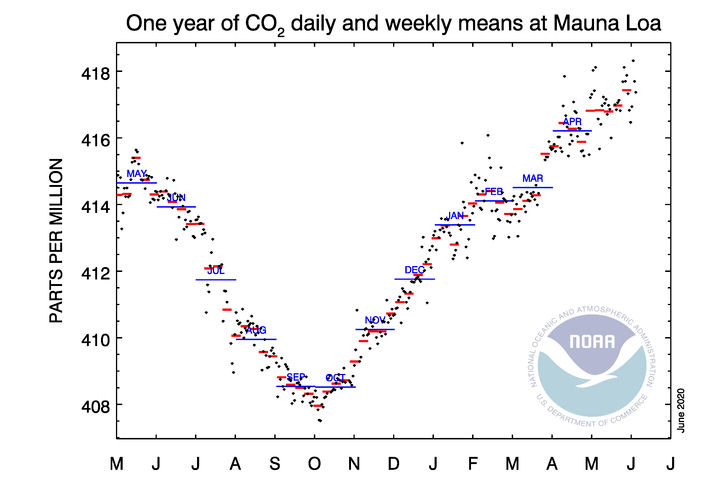
The month of May has come to an end. Another month of economic paralysis and reduced human CO2 emissions. And again, the CO2 concentration in the atmosphere continues to rise to record levels in modern measurements.
It is time to remove the blindfolds and thoroughly analyze the question of the effect of human CO2 emissions on global temperature. I propose to divide the problem into four issues, open for discussion: Read more...
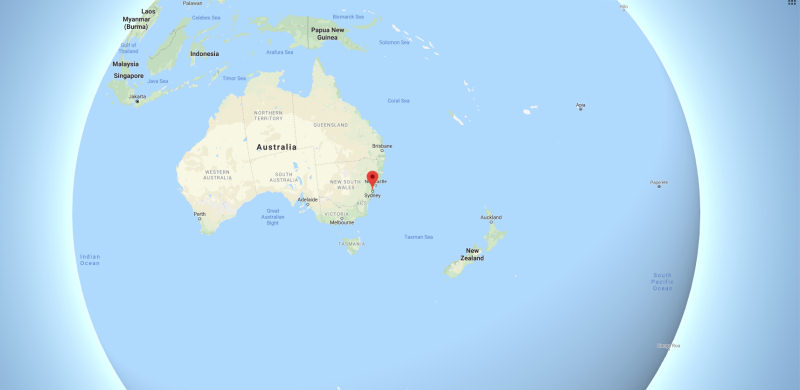
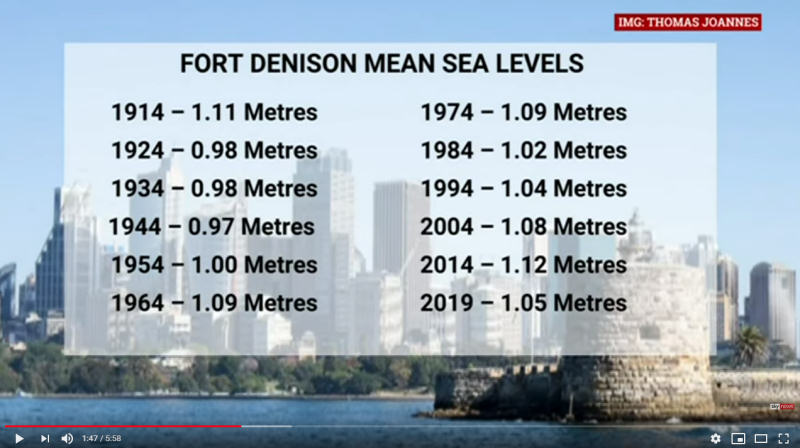
According to the IPCC CO2-hypothesis, rising CO2-levels leads to warming. That warming supposedly expands sea-water and melts glaciers and polar ice-caps, finally resulting in rising sea-levels. They warn us for catastrophic sea-level rises in the year 2100 and beyond because of this process.
Sydney is strategically located between the Indian, Pacific, and Southern oceans. CO2-levels went up from 300 to 400 parts per million over the past 100 years. What's the impact on Sydney's sea-level? Read more...
In recent centuries the power of governments has become stronger and stronger. The governments got involved increasingly deeper into our lives and the citizens, the individuals, have ever less to say about ever more issues.
Climate policy is an excellent example of this interference. The government relies on completely unreliable data, unproven hypotheses, and ideas while the consequences of this interference affect everyone. At present, governments worldwide are about to make cheap and reliable energy sources -that form the basis of our economic prosperity- inaccessible. The results are far-reaching. Read more...
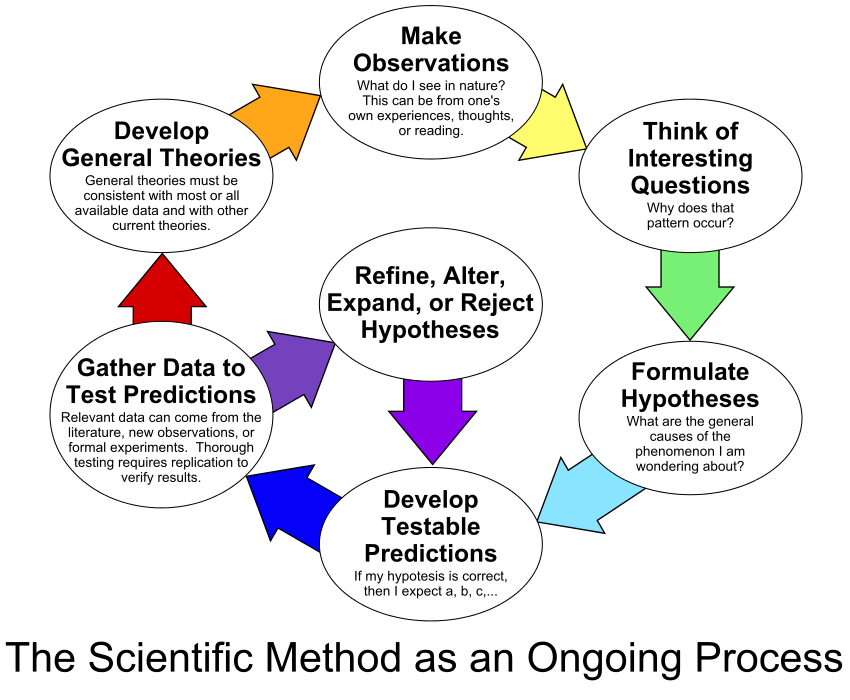
There are four misconceptions about science that are commonly used by catastrophic man-made warming advocates. Normally, when you try to start a conversation on the subject, their first reply will be one of these four "arguments". Read more...
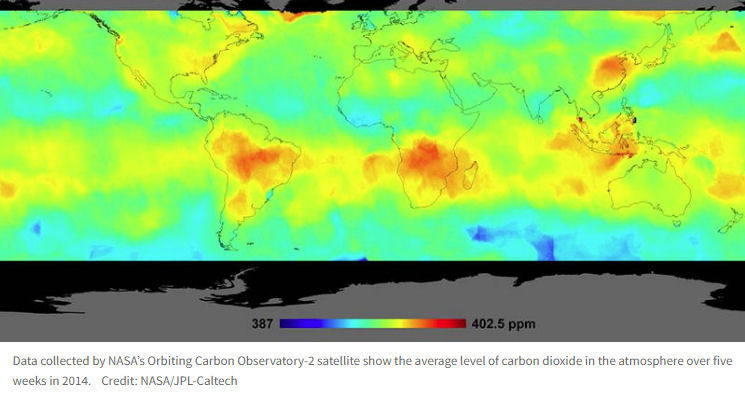
On the above world map we see the average level of carbon dioxide (CO2) in the atmosphere over five weeks in 2014. Credit: NASA / JPL-Caltech. Read more...
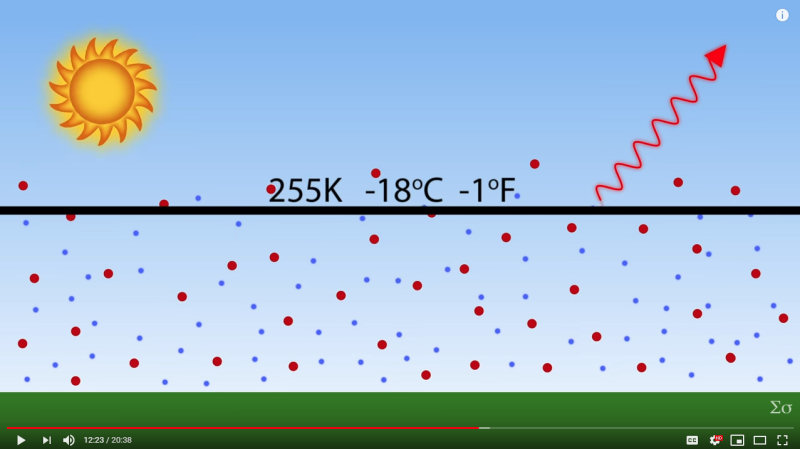
In this video Professor of Astronomy Michael Merrifield (University of Nottingham) presents a simple model of the CO2 greenhouse effect.
He leaves out clouds, albedo effect, ocean interaction, sun cycles and a lot of other factors that affect the climate and discusses only the CO2 radiation in the atmosphere.
Then, he explains his hypothesis for a surface temperature of 15 °C. And yes, that might be the Earth's approximate average temperature, but in the real world, temperatures vary from -40 °C to 35 °C at any given moment. He does not explain how this hypothesis works under these circunstances.
His main argument is that when the CO2-concentration rises, the atmosphere will start emitting from a higher layer. The temperature at that emitting layer has to be -18 °C. So, if the -18 °C temperature layer is higher up in the atmosphere and as the temperature rises 6.5 °C for each kilometer we go down from that layer, the surface temperature will go up. Read more...
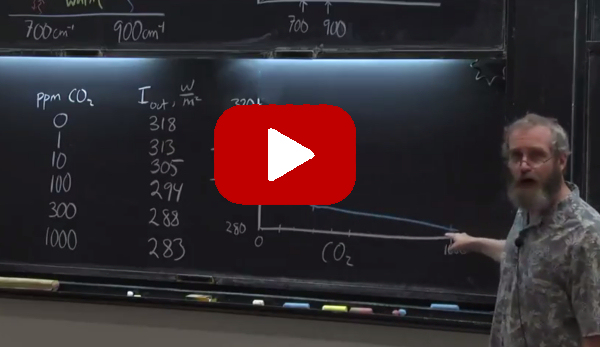
Professor at the Geophysical Sciences department at the University of Chicago David Archer describes the band-saturation of the CO2 greenhouse effect.
After that, everything goes wrong.
The first part of the lecture is very informative. Professor Archer explains in great detail how the CO2 greenhouse absorption works, it's logarithmic nature and the band-saturation. He even shows on a working instance of the MODTRAN model how adding the first ppm of CO2 to the atmosphere has a huge impact on the atmosphere's energy balance. Adding more CO2, the effect fades away. Read more...
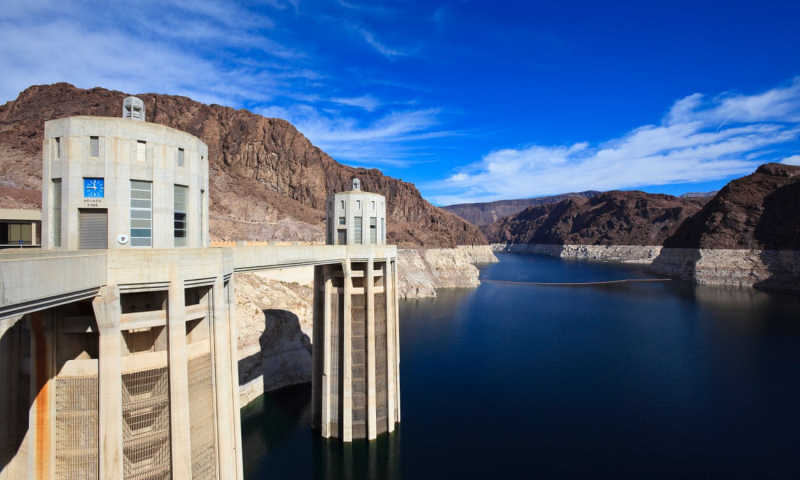
Hydropower is one of the cleanest energy sources available. The only downsides known so far are the impact on the landscape and the risk of a dam breaking due to earthquakes. Carefully choosing the locations and high construction standards are needed to solve these problems.
Besides electricity generation, dams also help to regulate the water flow in the rivers, making them better navigatable and useful for irrigation.
So, overall it seems to be quite positive, but recent research has "discovered" a new downside to hydroelectricity and it's a usual suspect: Greenhouse gasses. Read more...
Interview with Professor William Happer of Princeton University. Mr. Happer is a renowned physicist, specialized in the field of atomic physics, adaptive optics and spectrometry. This interview from 2015 is part of the series "Conversations that Matter."
For many people, a logarithmic relationship can be a fairly abstract concept. It is hard to imagine the implication that it has on the strength of the greenhouse effect that corresponds to the amount of CO2 that humanity emits into the atmosphere. Here we present a visualization to explain in a simple way what we are talking about.
CO2 is a greenhouse gas. The presence of CO2 in the atmosphere traps a part of the infrared radiation that the Earth's surface emits into space. The total greenhouse effect of the Earth's atmosphere is about 30 °C, without this effect, the temperature would be -15 °C instead of +15 °C, the actual current average temperature.
Water vapor is the most important greenhouse gas. CO2 provides 3 °C of heating, that is, 10% of the total effect.
When the concentration of CO2 increases, its greenhouse effect also increases, but not in a linear fashion, but logarithmically. For each increase in concentration, the effect on temperature is less and less. Read more...
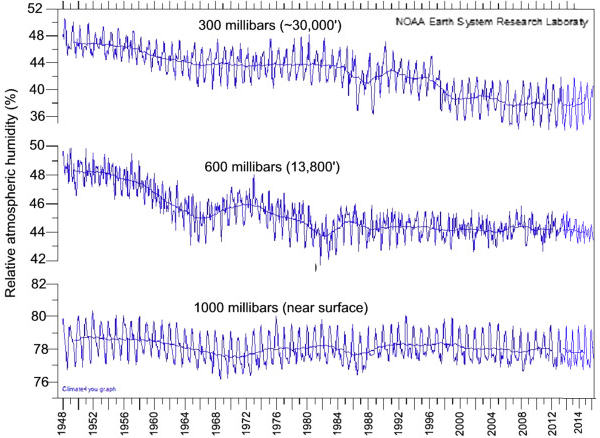
Water vapor is the single most important greenhouse gas. It makes up 80% to 90% of the total greenhouse effect of the Earth's atmosphere.
Climate models depend on water vapor as a positive feedback for supposed CO2 warming. In these models, CO2 causes a tiny warming that causes the relative atmospheric humidity to increase. That increase in water vapor produces the catastrophic warming they predict.
The problem is that in the real world, while atmospheric CO2-concentrations increased by almost 30% since the end of World War II, the relative atmospheric humidity has been stable at low altitudes and has even decreased at higher altitudes. Read more...
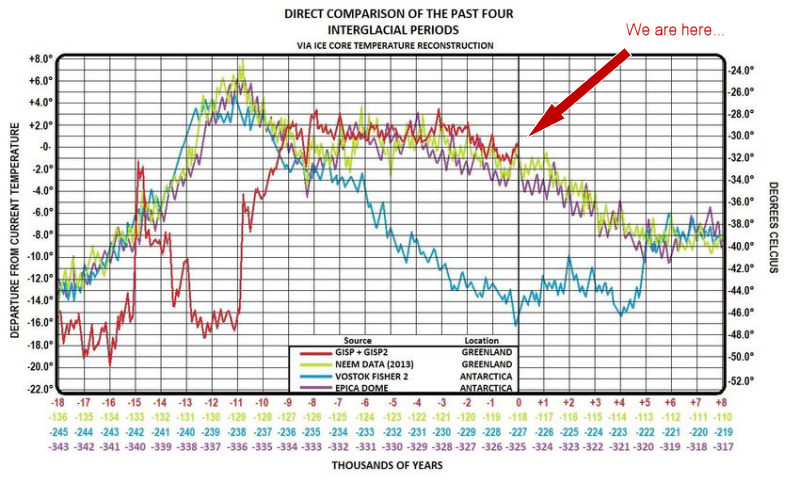
This picture is part of a very interesting paper by independent researcher Brian Catt about the effects of magma and volcanism on the ocean heating through glaciation cycles.
The graph of 4 Interglacial Data Sets was created by James Covington.
It shows the temperature for the last four interglacial periods. Each interglacial has it's own color:
Red - The Holocene, from 18,000 years ago until today ("We are here...")
Green - The Eemian , from 136,000 years ago until 110,000 years ago
Blue - Interglacial "MIS 7", from 245,000 years ago until 219,000 years ago
Purple - Interglacial "MIS 9", from 343,000 years ago until 317,000 years ago
Fighting the climate hysteria is time-consuming! If you think I'm on the right track and you want to support my efforts
I would be more than happy to receive a small donation that will help me to maintain this site.