Why did the warming stop?
02/04/2019 11:46 - Posted by Tom van Leeuwen
The political reports of the IPCC are based on the hypothesis that CO
2 is the most important control knob of the Earth's temperature. The problem is that this hypothesis does not correspond at all with the empirical data available to science.
Forecasts are made using models that are not capable of 'predicting' the past.
In the previous article
"Temperature versus CO2 – the big picture" we saw that on virtually all time scales there is no clear positive correlation between CO
2-concentration and temperature. Here we will discuss a period in which the CO
2-hypothesis would predict a completely different outcome than what happened in reality.
The current ice age
Geologically speaking, we are in an ice age, because there is permanent ice in both polar regions. The terms "glacial period" and "interglacial period" are used to indicate the large fluctuations within this ice age.
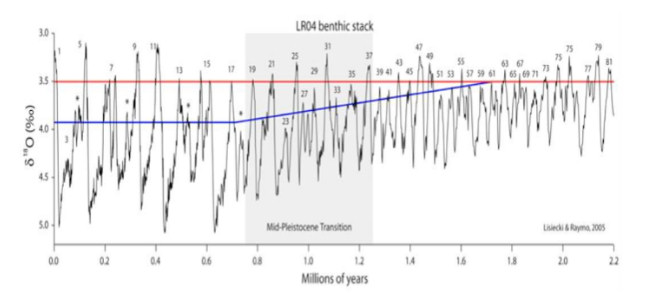
On the horizontal axis of this graph, we see the time scale in millions of years, with the present on the left. On the vertical axis, the increase in the oxygen isotope
18O, a proxy (indication) for temperature. So these are not degrees Celsius.
During our ice age, there have been about 30 glacial and interglacial periods, apart from smaller fluctuations. We see that the temperature at the beginning of each interglacial rises quite abruptly, always up to about the same level. The rise also always starts around the deepest minimum of the preceding glacial period, the so-called glacial maximum.
To get a better picture of the conditions during a glacial maximum, we have a look at the last three glacial cycles.
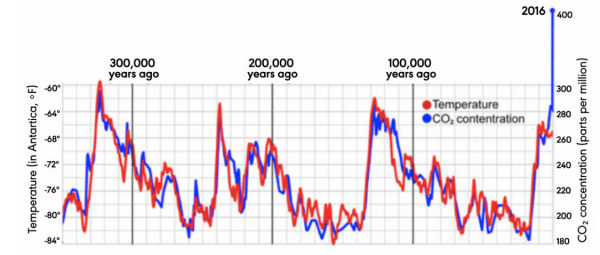
Here red is the temperature, blue is the CO
2 concentration and the horizontal axis runs from left to right, so with the present on the right.
During the entire ice age, CO
2 concentration and temperature always went hand in hand. The humidity of the atmosphere is also very low during glacial maxima, as a lot of water is stored in the enormous ice caps.
The concentrations of the two most important greenhouse gases, water vapor, and CO2 were extremely low and therefore the greenhouse gas effect could come into effect. All it took was a first push to start the warming.
The warming starts
That first push is given by the Milankovich cycles. These are small, periodic variations in the earth's orbit around the sun and the angle of the earth's axis to its orbit. Climate author Javier gives a
complete overview of these cycles. This article is highly recommended.
When the first warming is established, greenhouse gases are released into the atmosphere because warmer water can contain less CO
2 and evaporates more easily. CO
2 is also released from the thawing tundra. A chain reaction starts. More heat, more greenhouse gases, more heat absorption, more heat, etc.
This part of the reasoning is very similar to the IPCC hypothesis.
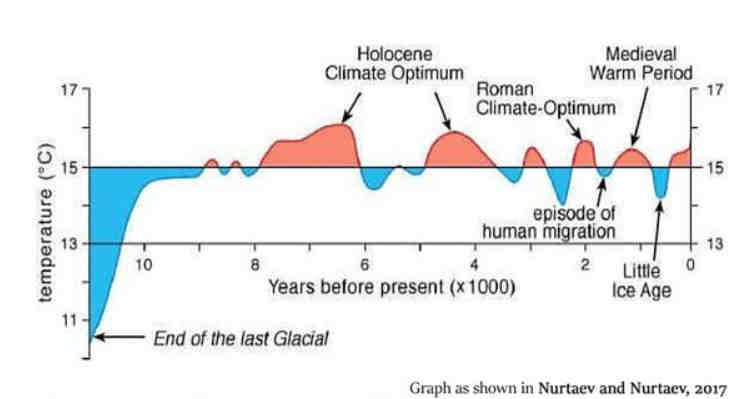
Let us now enlarge the endpoint of the last warming, at the beginning of the Holocene, and that will lead us to the central question of this article.
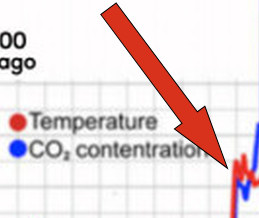
There was warming, more than enough greenhouse gases were released and the greenhouse gas chain reaction was in full swing.
According to the CO
2 hypothesis, this would be exactly the circumstance to start an irreversible runaway heating process. A tipping point.
But that did not happen. The warming suddenly leveled off and the temperature clearly reached a stable level. And not once or twice... at the beginning of all 30 interglacials, exactly the same thing happened,
in total contradiction with what should have happened according to the CO2 hypothesis.
So the question is:
Why did the warming stop?
The only "logical" answer that could be given from the point of view of the CO
2 hypothesis is that warming stopped because no more CO
2 was released and that that stable level would later be disturbed by man.
It is very doubtful that the oceans and tundra would suddenly stop emitting CO2 and repeat it 30 times at almost the same level. Furthermore, this reasoning is only valid if you only consider CO2.
But water? Water was abundantly available and the greenhouse effect of water is much stronger than that of CO
2. Not only is there
on average 10 times as much water in the atmosphere as CO
2, water also absorbs much more and wider electromagnetic frequency bands.
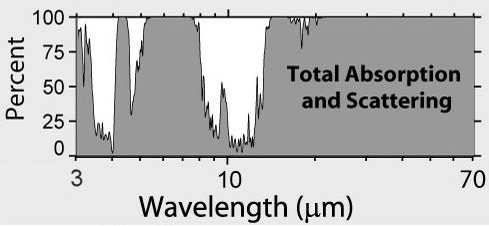
Heat consists of many electromagnetic wavelengths, each greenhouse gas is able to absorb only a part of those wavelengths. The radiated heat that is not absorbed disappears directly into space.
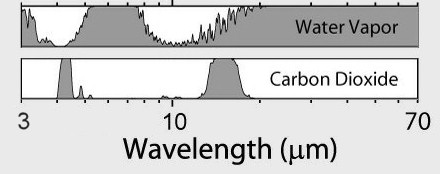
In the graph, we see on the horizontal axis the wavelengths of the thermal radiation. The vertical axis is the percentage of absorption by the atmosphere. The upper graph is water, the lower graph is CO
2. It is clear that CO
2 can only absorb a very small part of the heat, water a much larger part.
Together with the fact that the concentration of water in the atmosphere is on average 10 times greater than that of CO
2, we can easily see that water vapor's greenhouse effect is about 50 times stronger than the CO
2 greenhouse effect.
The mere fact that the IPCC only considers CO2 as the central control knob of the Earth's temperature and only gives its 50 times larger brother H2O a role of positive feedback gives much to think about the real intentions of this organization, and about the intentions of the thousands of "scientists" who uncritically adopt their conclusions, without raising the alarm.
But, what did happen?
Why did the warming stop?
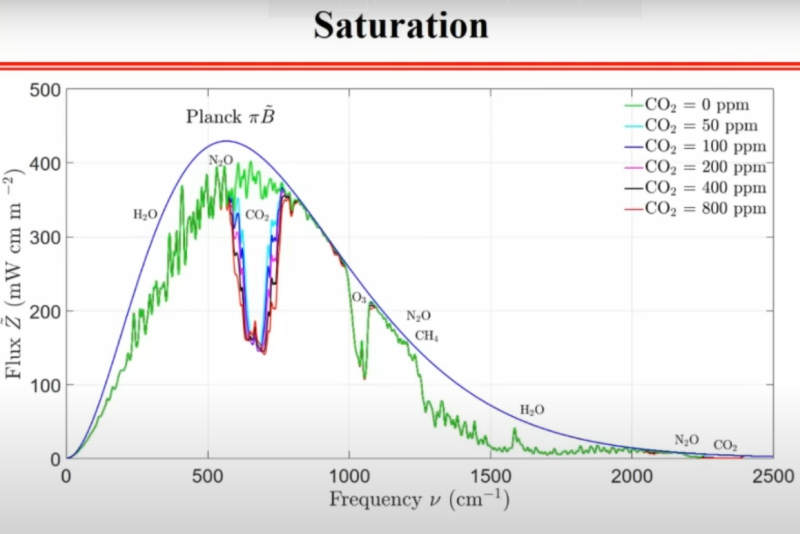
The answer is "saturation". The force that caused global warming decreases as the concentration of greenhouse gases increases and is eventually completely overshadowed by other effects that affect the climate, such as solar activity. At that point, adding more greenhouse gas no longer has a measurable effect on temperature, so the effect is saturated.
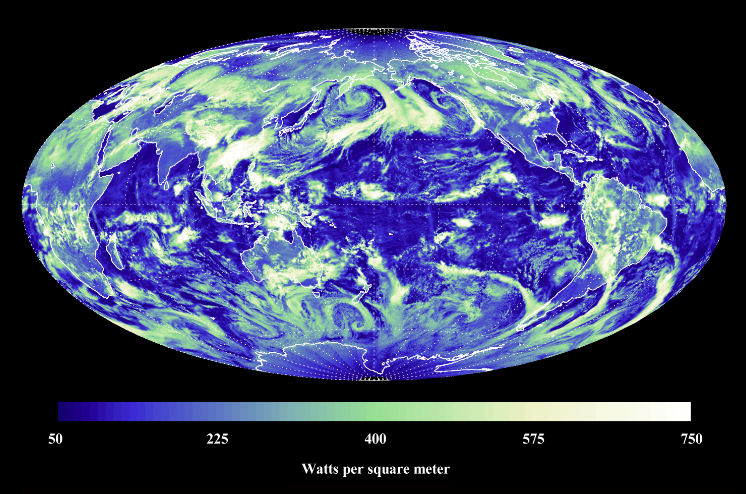
So far we have come to this conclusion by analyzing its effect on temperature. Now let's look at it from another perspective, namely the total absorption of the Earth's atmosphere. Which frequency bands are absorbed to what extent?
In this graph, we see on the horizontal axis again the wavelengths of the thermal radiation and on the vertical axis, the percentage of absorption of these wavelengths by the Earth's atmosphere.
To make the comparison a bit easier, below are the graphs of the total atmosphere and CO
2 together in one picture.
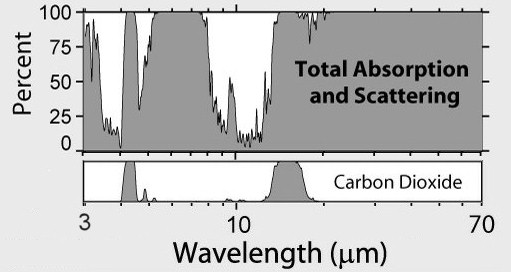
Here we see quite clearly that almost all the heat formed by the wavelengths that CO
2 can absorb is already absorbed at current levels.
The conclusion that we had obtained on empirical grounds, that the CO
2 greenhouse gas effect is already almost saturated, is therefore correct.
This fact has been known for a long time. Back in July 1971, two scientists from NASA (J.I. Rasool and S.H. Schneider) wrote in an article in
Science (Vol 173) (pdf) the following (second page, second column):
“
However, if more CO2 is added to the atmosphere, the rate of temperature increase is proportionally less and less and the increase eventually levels off. Even for an increase by a factor of 10, the temperature increase does not exceed 2.5°K. Therefore the runaway greenhouse effect does not occur because the 15-micrometer CO2 band, which is the main source of absorption “saturates” and the addition of more CO2 does not substantially increase the infrared opacity of the atmosphere.”
J. I. Rasool en S. H. Schneider, NASA
Adding more CO
2 to the atmosphere has no measurable influence on the Earth's temperature.
So we don't have to worry about CO
2 emissions at all.
Closing remarks
Sooner or later the Milankovich cycles will turn against us and herald the end of the Holocene. Temperatures will start to drop.
If we -as mankind- emit enough CO2 into the atmosphere it may well be possible that the CO
2 greenhouse effect remains saturated despite the cooling. This would considerably mitigate the devastating effect of the next glacial period.
Remember that all the carbon that is now stored underground in various chemical compounds as fossil fuels was once part of the Earth's biosphere in the form of CO2, and that was a completely natural and sustainable situation.
The continued use of fossil fuels, therefore, has the following advantages:
- A cheap, reliable energy source that does not endanger our international competitiveness and assures us of always available heat and electricity for the entire population.
- A greener earth, better harvests. CO2 is plant food
- A preventive protection against the effects of the coming glacial period.
Tom van Leeuwen, January 2019