Censored and kicked by a Facebook group!

10/29/2019 12:36 - Posted by Tom van Leeuwen
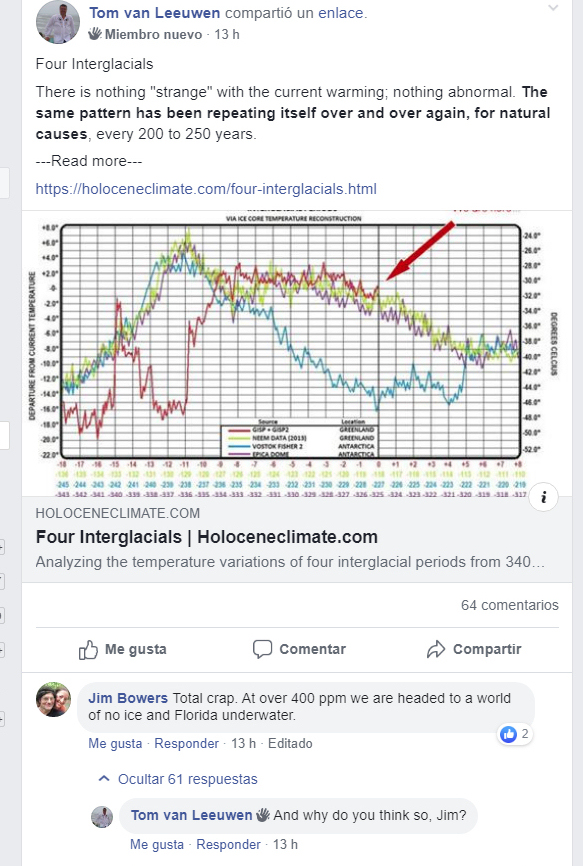
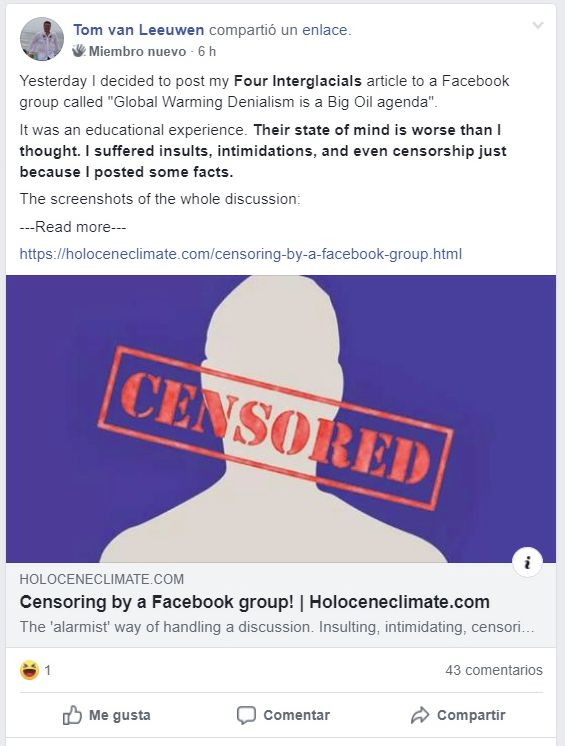
Yesterday I decided to post my
Four Interglacials to a Facebook group called "Global Warming Denialism is a Big Oil agenda".
It was an educational experience.
The article is quite neutral. It's based on widely-accepted ice-core datasets and it draws some completely obvious conclusion from observing the data.
Then the wild ride began.
After a couple of seconds, the first comment came in:
Jim Bowers Total crap. At over 400 ppm we are headed to a world of no ice and Florida underwater.
During the 62 comments that followed I gathered the following qualifications: "crap", "layman", "dense", "denier", "delusional", "stupid", "bullshit", "ignorant", "liar", some of them described the article, but most of them were used to describe me as an author.
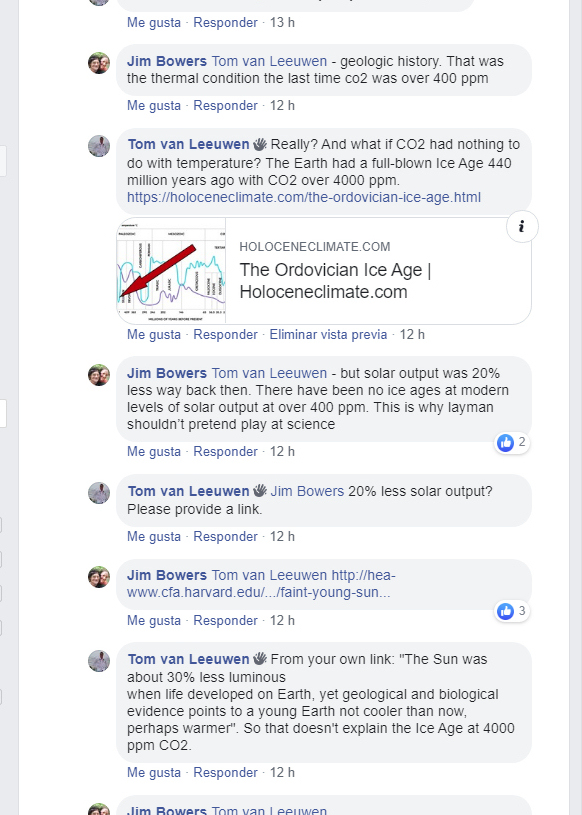
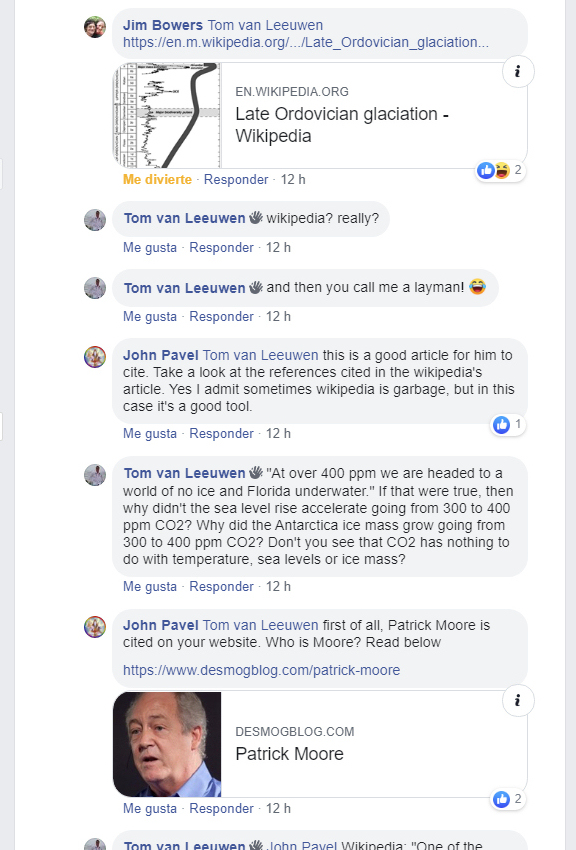
Furthermore, I registered one ad hominem attack against Patrick Moore in an attempt to discredit this website. Patrick Moore is cited in
a different article on the site and his remarks there have nothing to do with the "Four Interglacials" article.
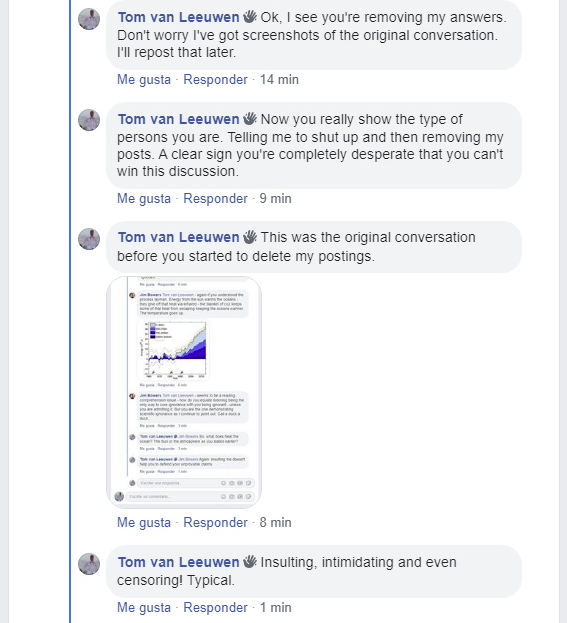
But worst of all, at a certain moment in the discussion, two of my posts disappeared. I don't know who censored it, Facebook or the group administrator, but I suppose it was the latter. Luckily I made a screenshot before the posts were removed.
Their state of mind is worse than I thought. I suffered insults, intimidations, and even censorship just because I posted some facts.
Update October 30, 17:17
Now they kicked me from the group! I was really well-behaved as you can see in the conversations below. I never insulted anyone despite being insulted myself all along the way. These people are clearly allergic to other opinions. They want to protect their state of collective fear. Having a collective enemy comforts them. Extreme group-think, like a religious sect or cult.
I can't imagine a climate realist FB group kicking an alarmist.
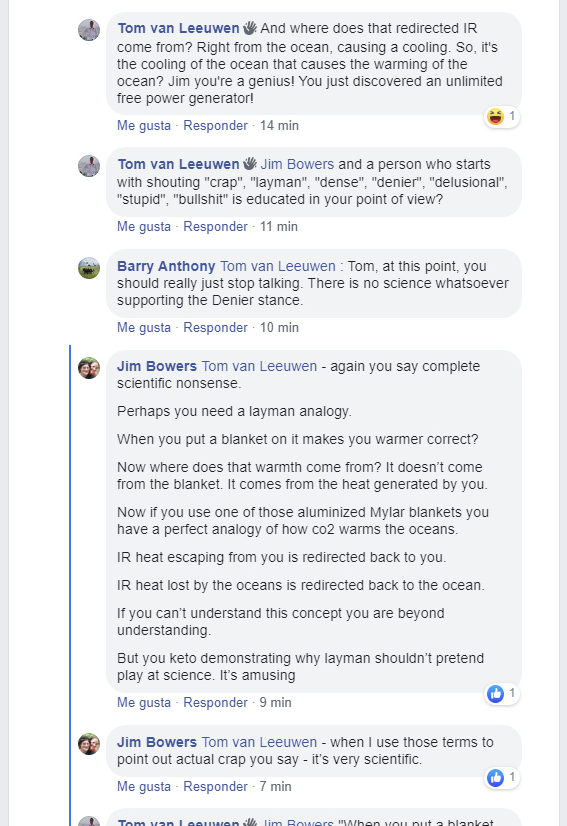
An extract of the "Blanket conversation" with Jim Bowes where he really mixes up warming and cooling.
Jim Bowes: "When you put a blanket on it makes you warmer"
Tom: "No. When I put a blanket on, it prevents me from getting colder"
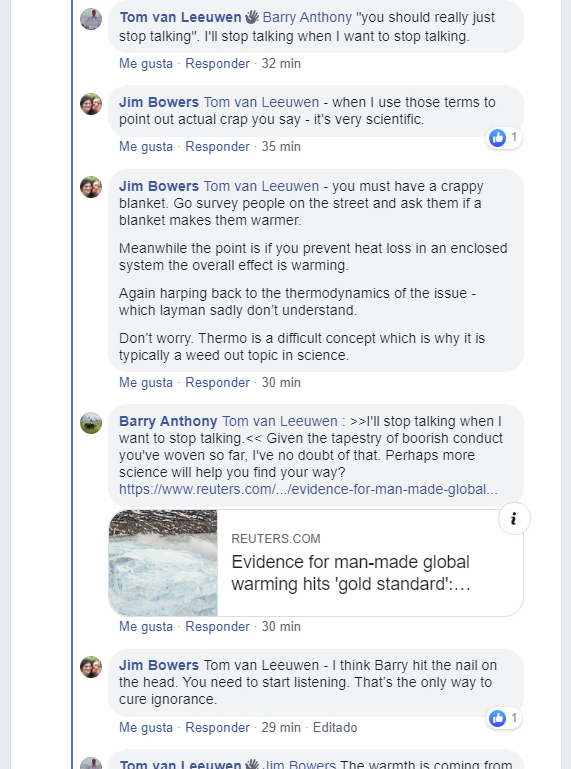
Jim Bowes: "You must have a crappy blanket. Go survey people on the street and ask them if a blanket makes them warmer"
Tom: "The warmth is coming from my own body, so I'm warming myself. Or do you have a magical blanket that generates heat? Where does that energy come from?"
In a later conversation:
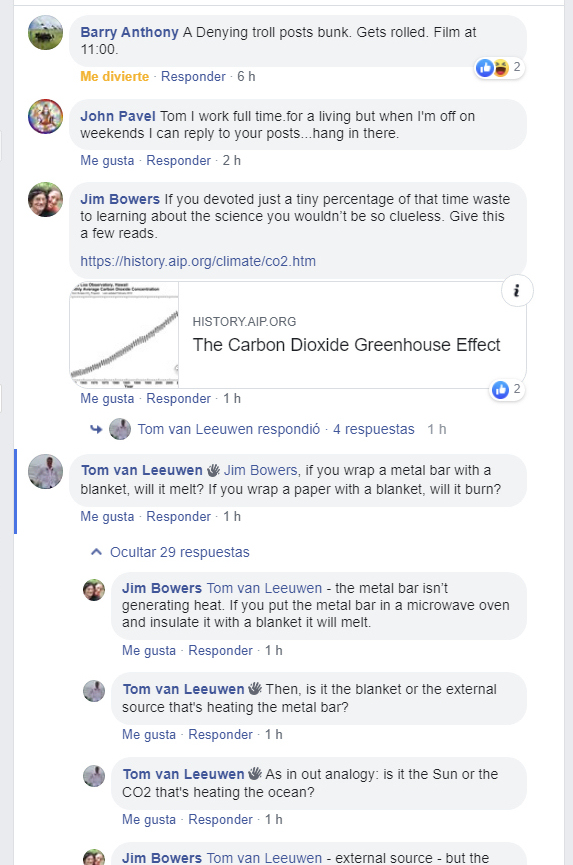
Tom: "If you wrap a metal bar with a blanket, will it melt? If you wrap a paper with a blanket, will it burn?"
Jim Bowes: "The metal bar isn't generating heat. If you put a metal bar into a microwave oven and insulate it with a blanket it will melt"
Tom: "So, is it the blanket or the external source that's heating the metal bar?"
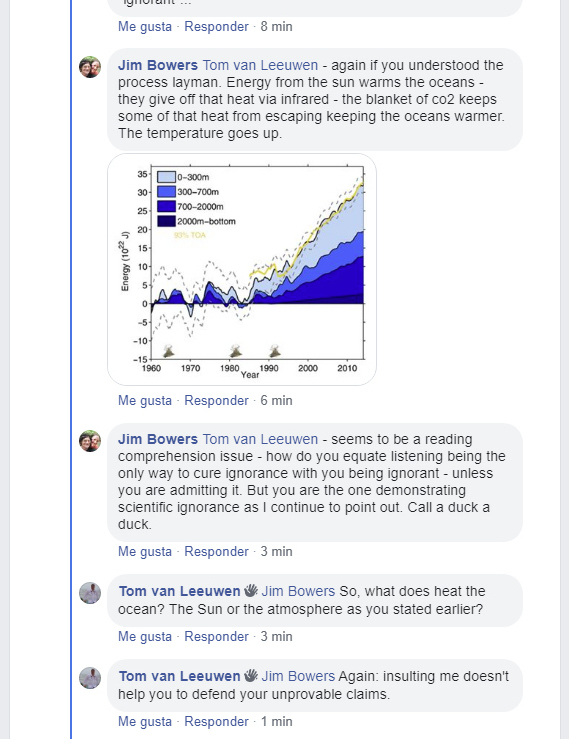
Tom: "As in our analogy: Is it the sun or the CO
2 that's heating the ocean?"
Jim Bowes: "External source - but it's the blanket that keeps the heat from escaping".
So, first Jim affirms that a blanket will make you warmer, but later he says it's an external source that warms the object and that the blanket just keeps the heat from escaping.
And that's exactly what I told him in the first part of the conversation "When I put a blanket on, it prevents me from getting colder."
Then, another part of our conversation, about the heating of the oceans:
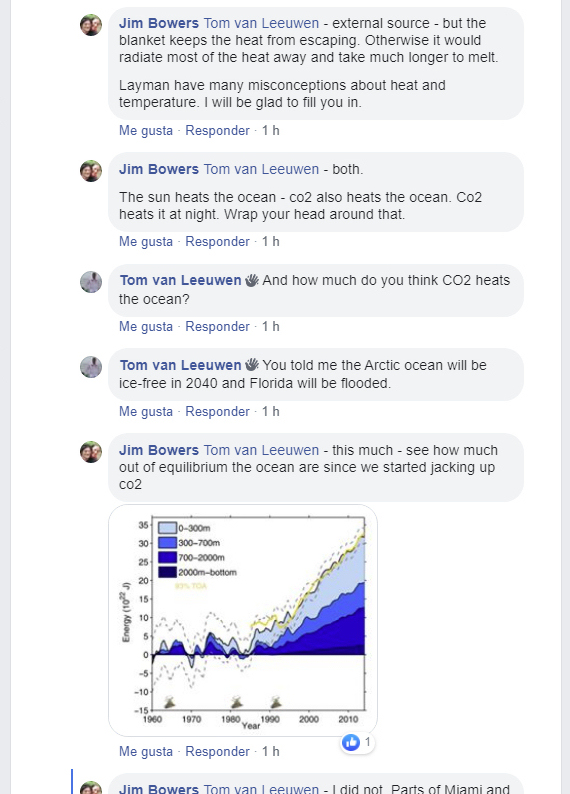
Tom: "And how much do you think CO
2 heats the ocean?"
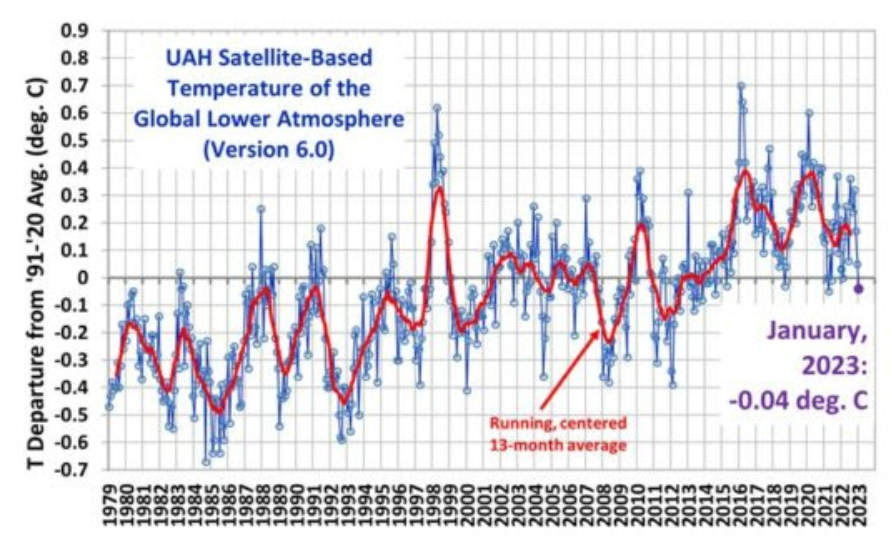
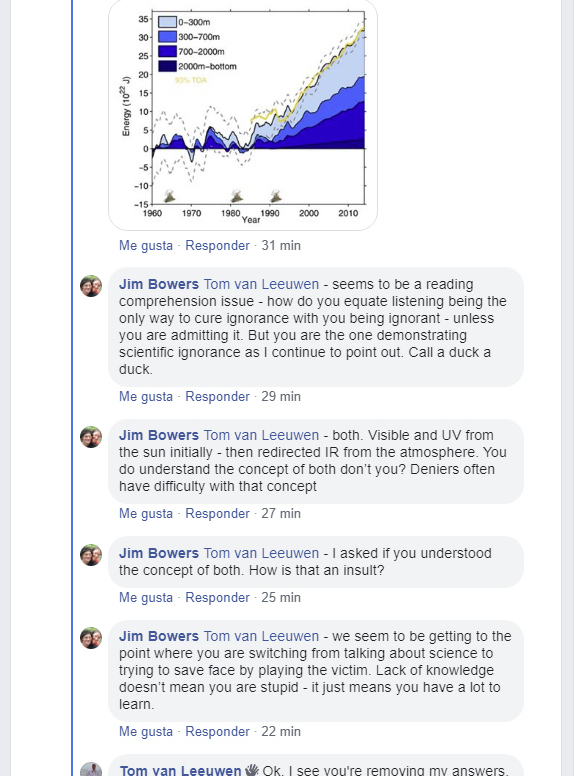
Jim Bowes: "This much - see how much out of equilibrium the ocean are since we started jacking up CO
2"
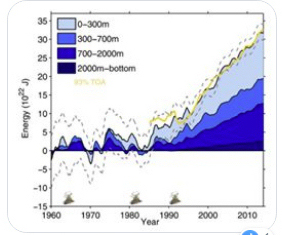
He refused to give me the source of that graph, but the increase of energy of 35 x 10
22 Joule from 1980 until 2020 is clearly visible.
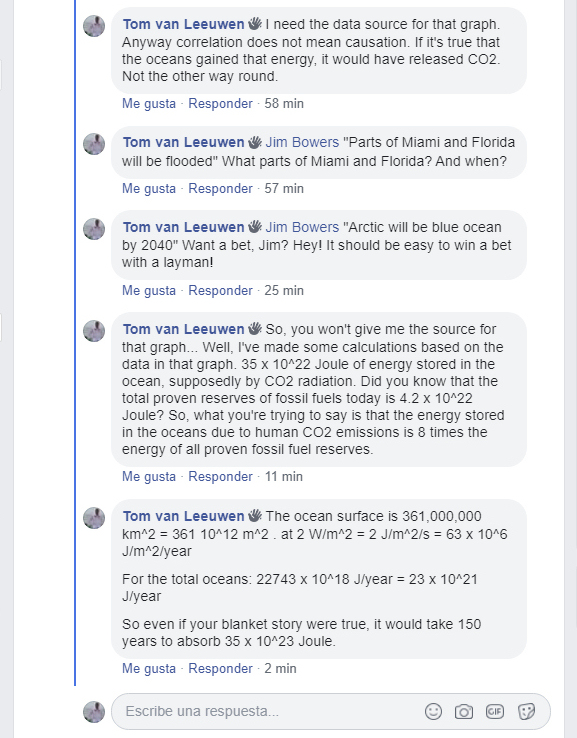
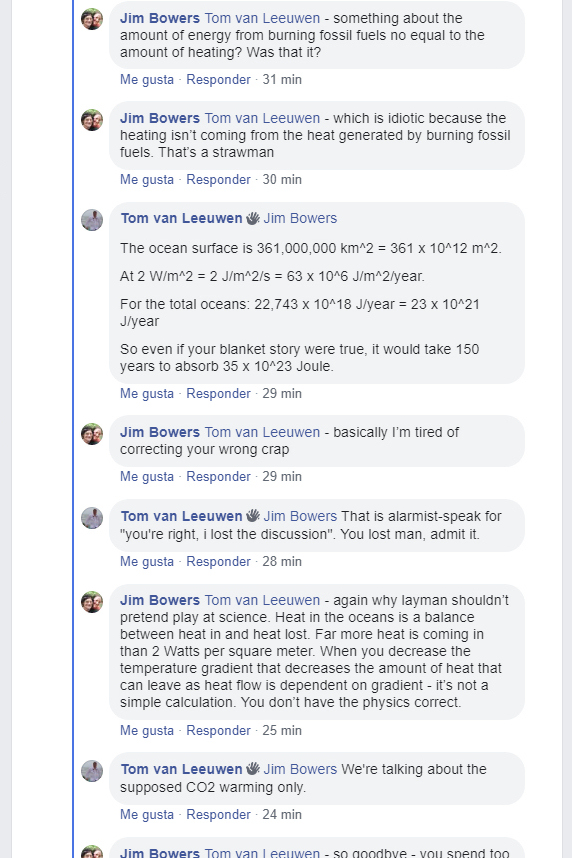
I presented him a calculation, assuming 2 W/m
2 of additional forcing by the enhanced CO
2 greenhouse effect. Even if there were no energy loss, it would take 150 years to accumulate that amount of energy.
Jim simply disappeared from the conversation. Later, in another thread, he came back.
Tom: "even if your blanket hypothesis were true, it would take 150 years for the oceans to absorb that amount of energy."
Jim Bowes: "Far more heat coming in than 2 W/m
2"
Tom: "We are talking about the supposed CO
2 warming only".
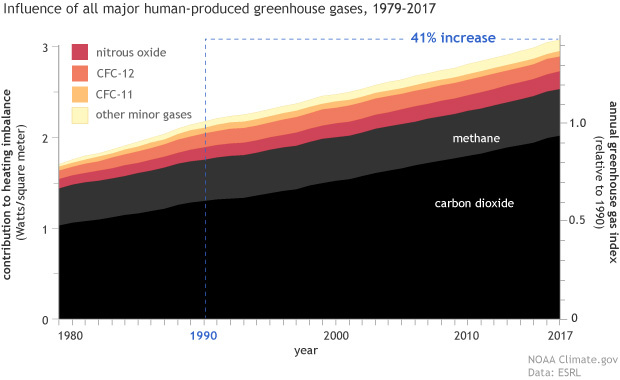
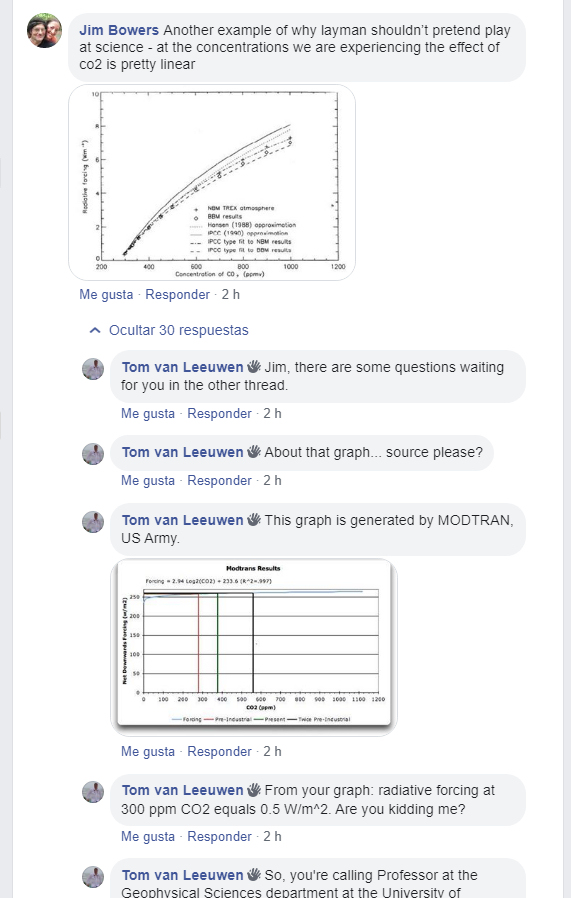
This graph comes from NOAA depicting the
supposed greenhouse effect according to the alarmists. Clearly visible is the CO
2 forcing between 1 and 2 W/m
2. Most of that forcing is the natural forcing that was already present in the atmosphere before mankind started emitting CO
2, so I'm even quite generous assuming 2 W/m
2 of additional forcing. According to Jim Bowes "Far more heat coming in than 2 W/m
2".
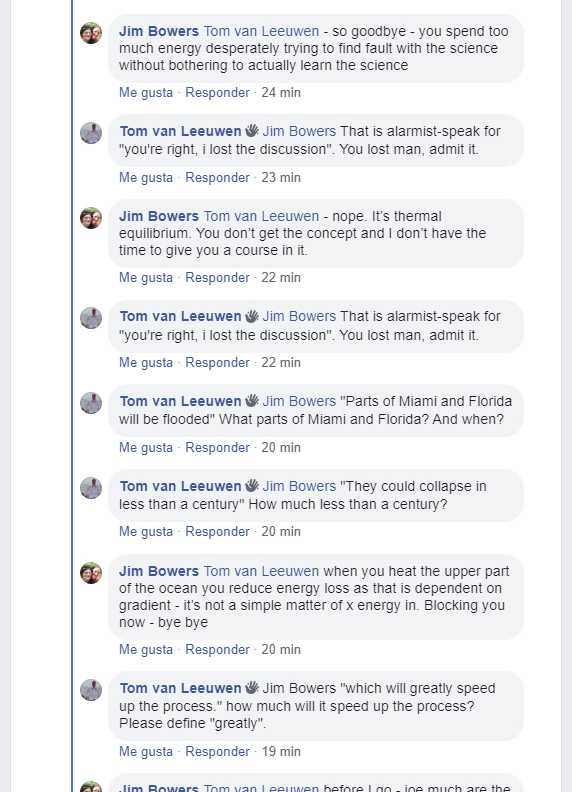
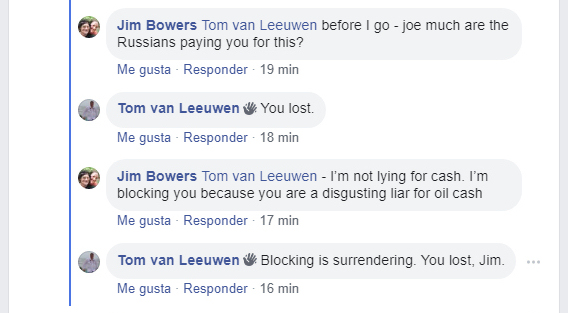
Jim Bowes: "I'm blocking you because you are a disgusting liar for oil cash"
The screenshots of the whole discussion:
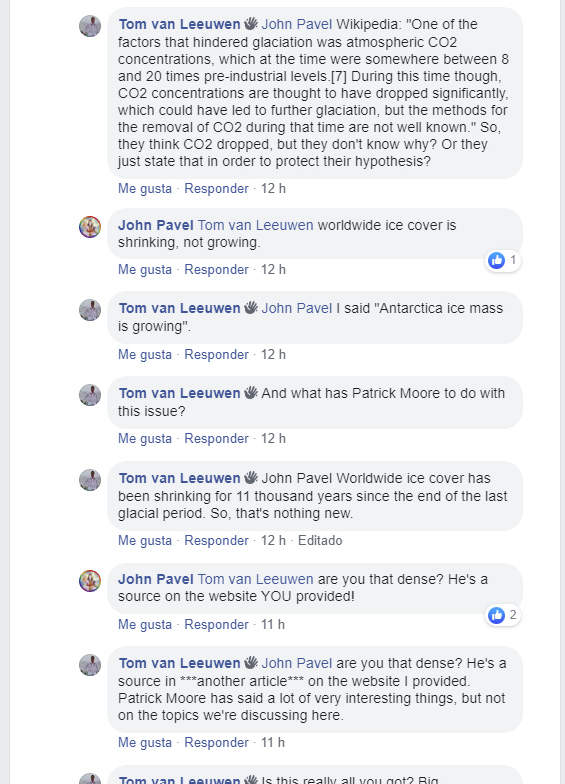
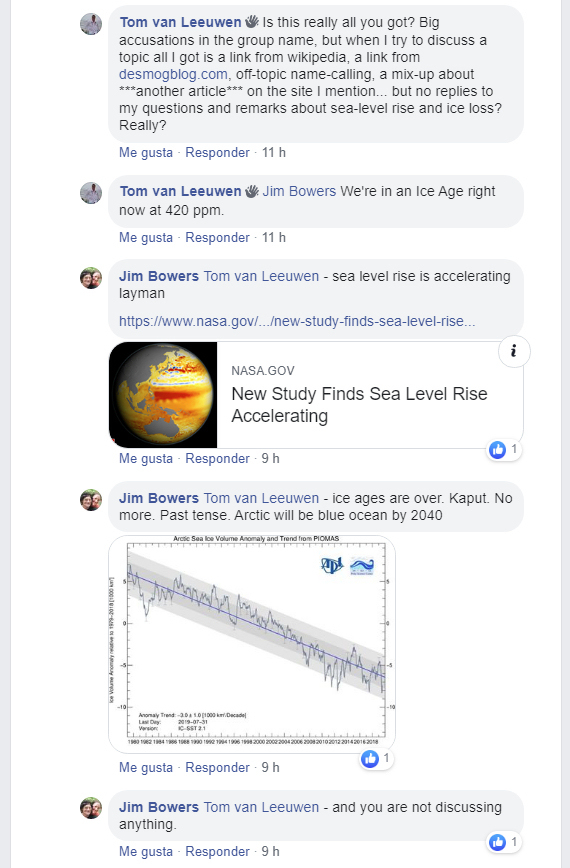
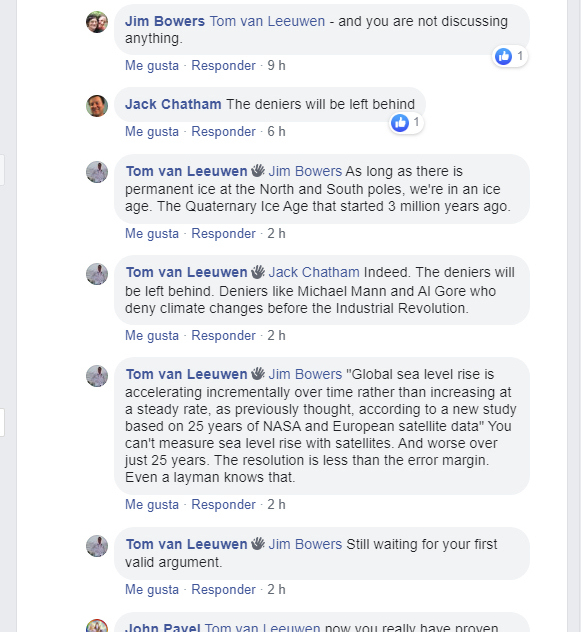
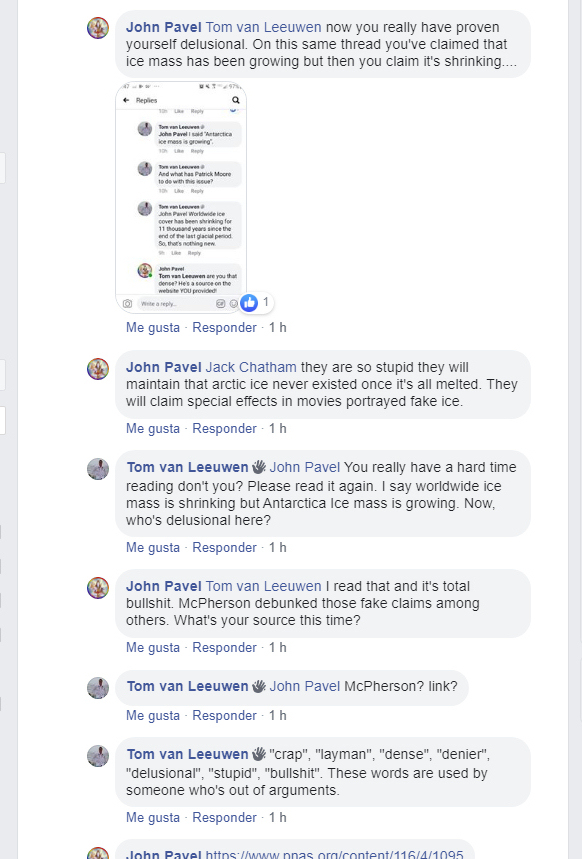
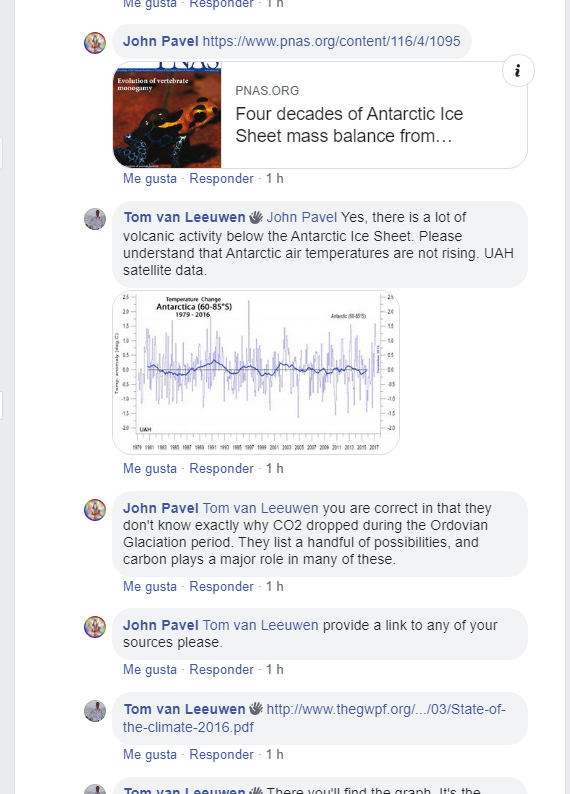
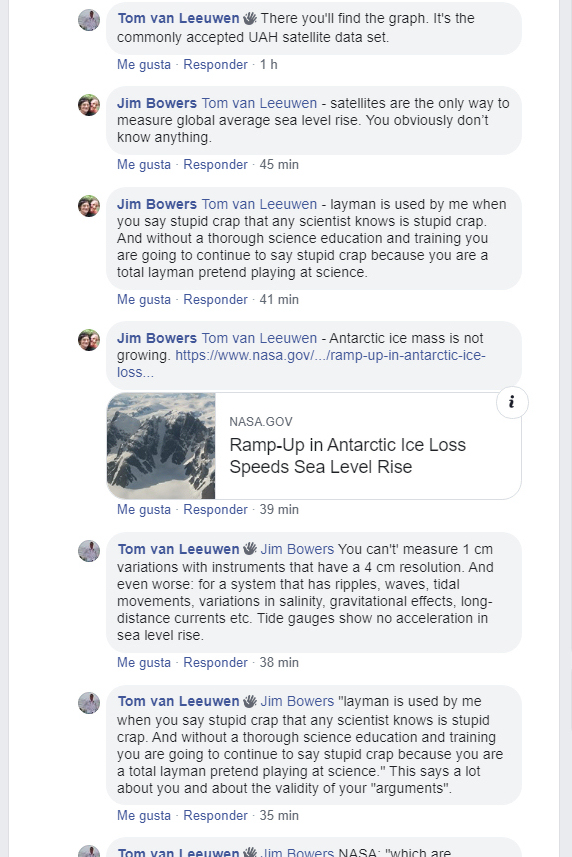
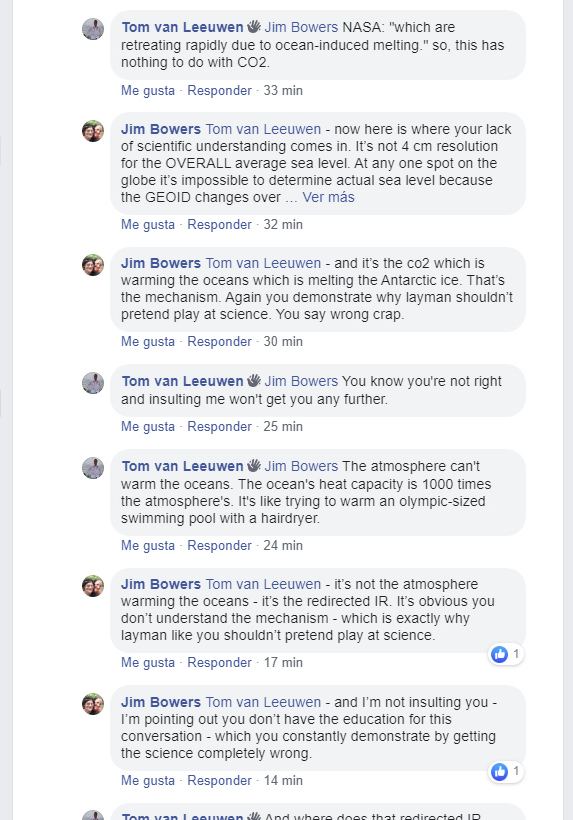
This is where all a sudden my two posts disappeared. After censoring my posts, the conversation went on like this.
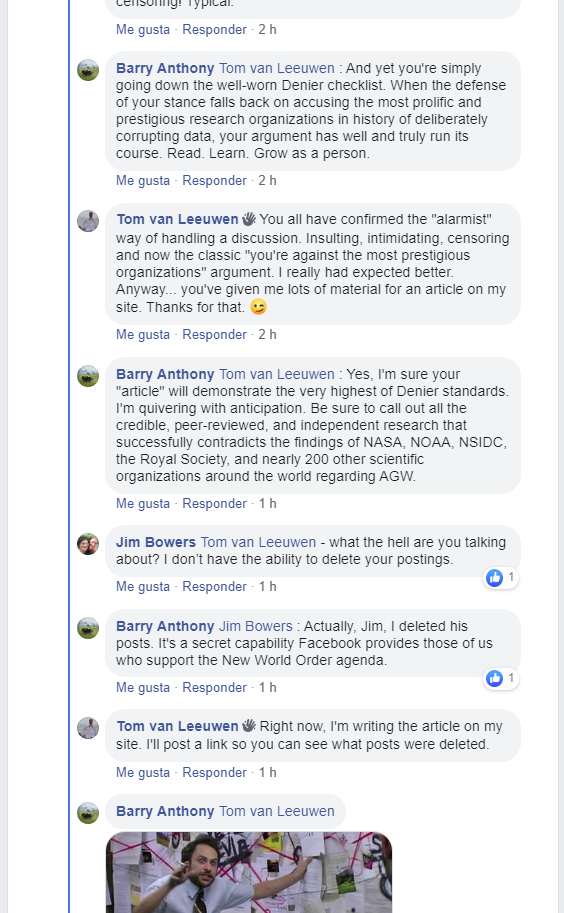
Edit October 30, 21:51 - I decided to share the article you're reading right now for their group. There, discussion went on like this:
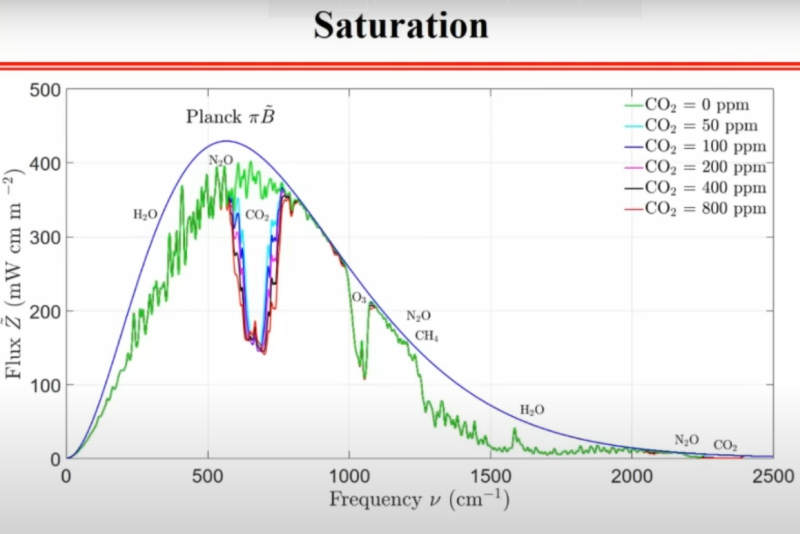
Jim Bowers never came back to that thread. Then, I decided to share my article CO2 Band-Saturation Explained with the group. There, Jim Bowers re-joined the discussion. When he realized he was losing the argument he blocked me.
Please read on, this is the part where Jim Bowers drops the towel.
A couple of hours later I was kicked from the group.
Tom van Leeuwen, October 29, 2019.