Dutch Warming
02/20/2023 11:30 - Posted by Tom van Leeuwen
In the Netherlands, the day-to-day whether depends heavily on the direction the wind is coming from. Being a small country, the wind direction is quite homogeneous for the whole country, specially on higher altitudes where the bulk of heat convection is taking place.
Due to its geographical position, midway between the icy-cold Arctic to the north, the dry and hot Sahara to the south, the Eurasian land-mass to the east and the Atlantic Ocean to the west, every wind direction comes with unique weather characteristics.
North - cold,
East - dry,
South - warm,
West - wet whether.
Over the past 30 years, the Netherlands have warmed quite a lot. In order to explain this fact, the authorities point at the rise in CO
2-concentration and its supposed increased greenhouse gas effect. But, as the CO
2-concentration rises at the same rate all over the world, why is the warming so much stronger in Western Europe?
If the wind direction is so important for the whether conditions, then why could not the same be true for the longer term climate changes?
Luckily, there is a lot of whether data available for the Netherlands, so father and son Jippe en Han Hoogeveen from the Department of Information and Computing Sciences, Utrecht University, in the Netherlands decided to analyze that data to solve this question.
(Hoogeveen, J., & Hoogeveen, H. (2023). Winds are changing: An explanation for the warming of the Netherlands.International Journal of Climatology,43(1),354–371.
https://doi.org/10.1002/joc.7763)
They disposed of over 180 years of daily whether maps from which high-altitude airflows could be extracted. Taking into account the
origin of the air-mass and last-minute turns, that resulted in a set of 24 different whether patterns. This information was used together with wind speed data, solar irradiance, information on the Atlantic Multidecadal Oscillation and the CO
2-concentration.
They created a computer program to analyze this huge amount of data. It is important to notice, that in this case the resulting model is not meant to predict the future as other climate models do, but only try to interpret and explain the past.
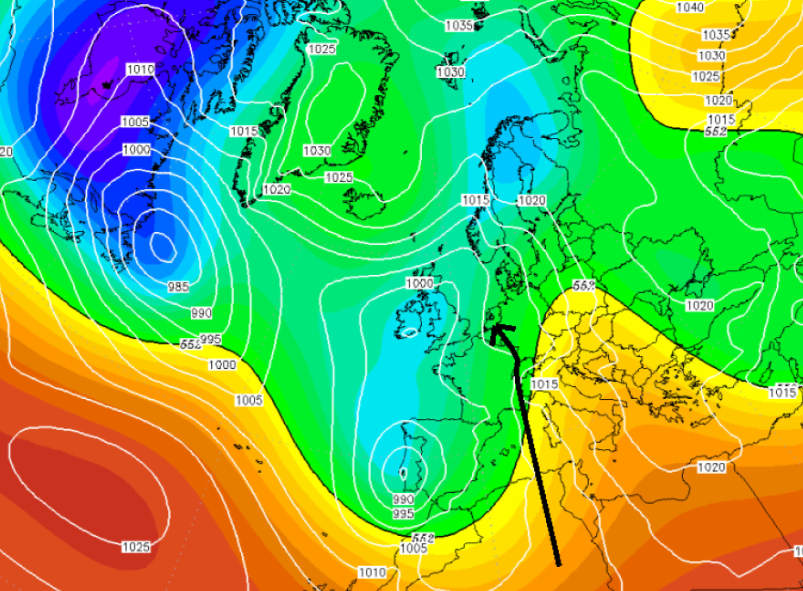
Comparing the 1960-1990 to the 1991-2020 periods, there is a noticeable increase of airflow coming from warmer directions
The results of this investigation are surprising: Comparing the 1960-1990 to the 1991-2020 periods, there is a noticeable increase of airflow coming from warmer directions. The influence of the CO
2-concentration is negligible. They tried CO
2 sensitivities ranging up to 3°C for a doubling of the CO
2-concentration, but the weather patterns were not affected and the CO
2-concentration turned out to be insignificant as a climate factor.
Their conclusion is that air-flow is the leading force behind the temperature increase in the Netherlands.
One real-life counterexample disproves any hypothesis, so if this holds for the Netherlands, we can conclude that the role of CO
2 in the worldwide climate change is much lower than the governments want us to believe, or even insignificant. Their destructive measures to ban fossil fuels are completely useless as lowering the CO
2 emissions will have no effect on the worldwide temperatures at all.
CO
2 is beneficial for life on Earth and burning fossil fuels give the poor countries a fair change to develop into first-world countries, caring for the environment, as we all want to do.
Tom van Leeuwen, February, 20th, 2023.