The fingerprints of the greenhouse effect
09/25/2019 14:06 - Posted by Tom van Leeuwen
The hypothesis of "man-made climate change" tells us that the increase in the concentration of
CO2 enhances the greenhouse effect of the atmosphere and has
global warming as a final result.
Since the beginning of the industrialized era around 1850, man emits relatively large amounts of CO
2 into the atmosphere through the use of fossil fuels. The consequence of these emissions is that during that period, the concentration of CO
2 in the atmosphere increased sharply from about 300 parts per million to more than 400 ppm, an increase of almost 40%. The average temperature increased in the same period more or less 1.5 °C with a small variation depending on the data source used.
There seems to be a correlation between the concentration of CO
2 and the earth's temperature in this period. But
correlation does not imply causality . It can be pure coincidence that these two concepts are developing in a synchronized way. In a
previous article we already saw that for other periods this correlation is nonexistent.
Infrared radiation fluxes
To check if there is a causality between these two concepts, we look for signs of phenomena inherent to the supposed heating process due to an enhanced greenhouse effect. These are like fingerprints that should be there if such an enhanced greenhouse exists. The measurement of these phenomena could lead us to a conclusion about the validity of the hypothesis.
According to the hypothesis, the increased concentration of greenhouse gases slows the cooling by infrared radiation of the earth's surface. This infrared radiation is absorbed by greenhouse gases and partially returned to Earth. This process would leave two fingerprints:
- In the lower part of the atmosphere, near the earth's surface, we should observe an increased flux of infrared radiation to the surface that would be the energy that would effectively heat the Earth
- In order for this energy to stay within the terrestrial system and can heat the Earth, in the highest parts of the atmosphere the tendency of the outgoing infrared radiation flux should remain constant or in any case, not increase more than the flux mentioned in the previous point.
What we are looking for is an alteration of the balance between conserved energy and energy lost to space. Without an alteration of this balance, the Earth can't be heated by the greenhouse effect.
This article explains in great detail how we came to identify these two fingerprints.
Checking the hypothesis
Combining the two fingerprints we can propose the following test to prove or disprove the hypothesis:
Test:
If there is an enhanced greenhouse effect, the flux of infrared radiation to the earth's surface should tend to gradually grow beyond the flux of infrared radiation into space.
If, on the contrary, there is no marked divergence in the trends of these two infrared radiation fluxes, the initial hypothesis would be refuted.
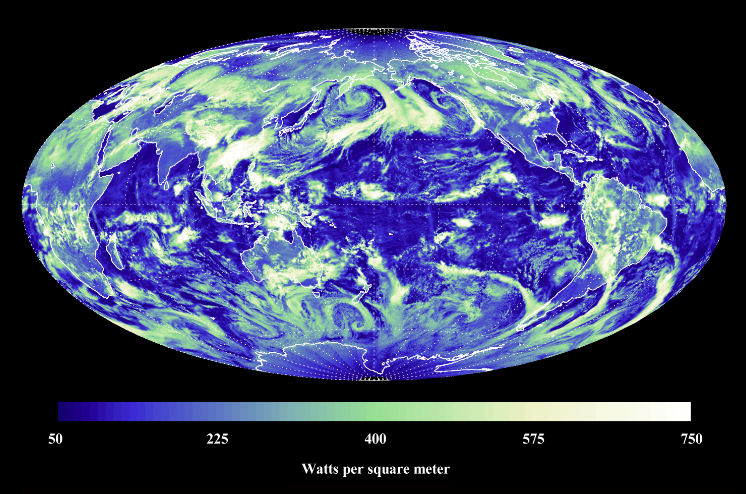
Fortunately, the satellite instruments
NASA CERES provides us since 2000 with detailed data on these infrared radiation fluxes.
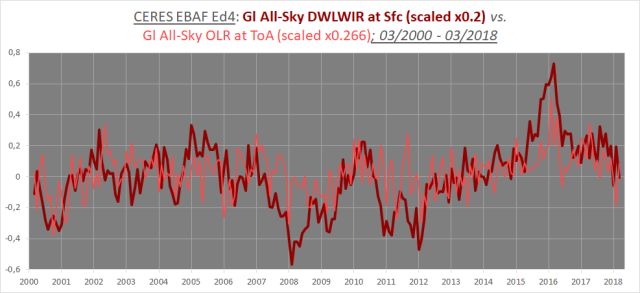
In the graph, we show the data of the CERES satellite measurement system. The light red line is the infrared radiation in the upper part of the atmosphere that will end in outer space while the dark red line is the infrared radiation directed to the earth's surface in the lower parts of the atmosphere.
We observe a clear coincidence of the two lines. There are periods of increase and decrease in radiation levels, especially during the period 2008-2012 that coincides with the consecutive phenomena of La Niña, El Niño and again La Niña and during the super-El Niño of 2016, but in no way can one speak of a gradual divergence between the trends of the two types of infrared radiation.
Conclusion
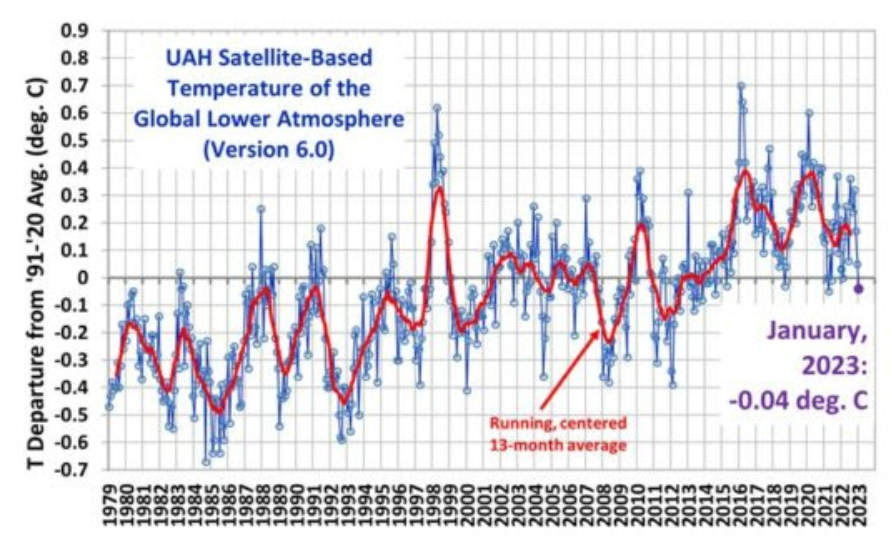
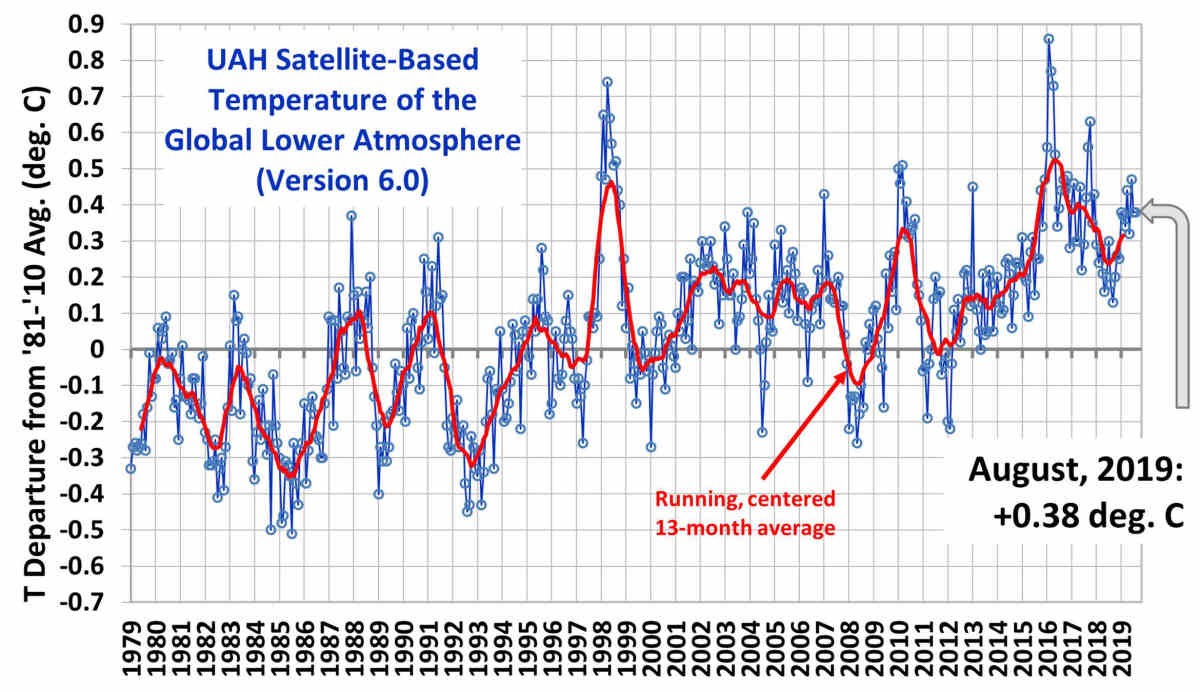
In the period from 2000 to 2018 we observed a clear increase in the concentration of CO
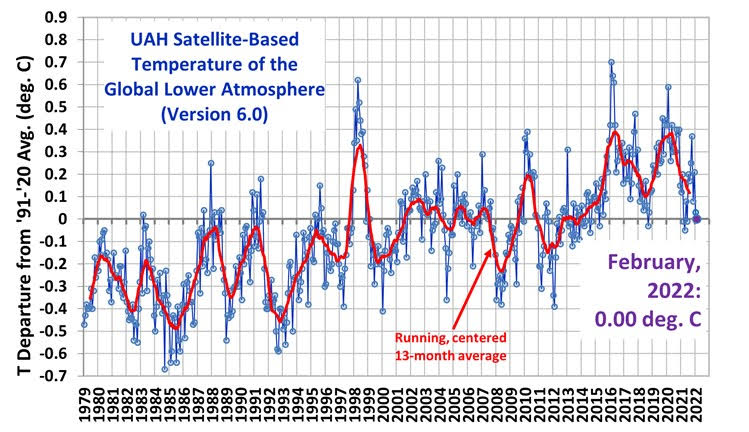
2 in the Earth's atmosphere. At the same time, the average earth temperature rose by about 0.3 °C (
satellite measurements from the University of Huntsville, Alabama (UAH)).
However, we do not observe any gradual divergence in the trends of infrared radiation flows in the upper part of the Earth's atmosphere compared to the lower part of the atmosphere, a divergence that would be a fingerprint of the increased greenhouse effect. The fingerprint is missing and therefore:
the hypothesis of climate change caused by human greenhouse gas emissions is refuted.
Natural causes
- If the actions of man do not cause that temperature increase, then what is the cause?
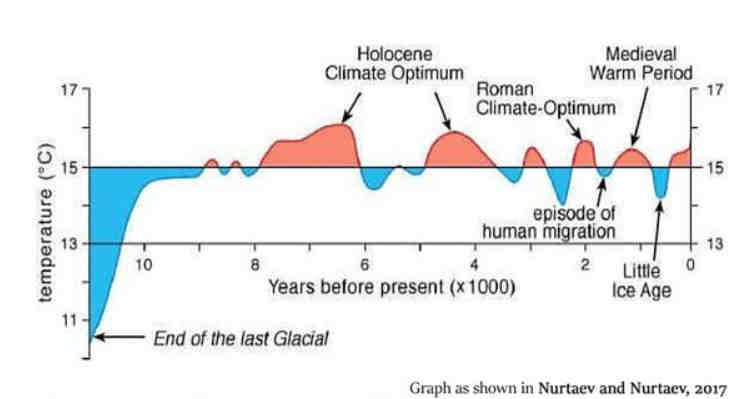
The start of industrial activity coincides almost perfectly with the end of the coldest period of the last 10 thousand years known as "The Little Ice Age". So the temperature rise since then is nothing more than the return to the 'normal' conditions of the Holocene before the Little Ice Age.
- If CO2 is a greenhouse gas and its concentration is increasing, then why does this not cause the temperature rise we observe?
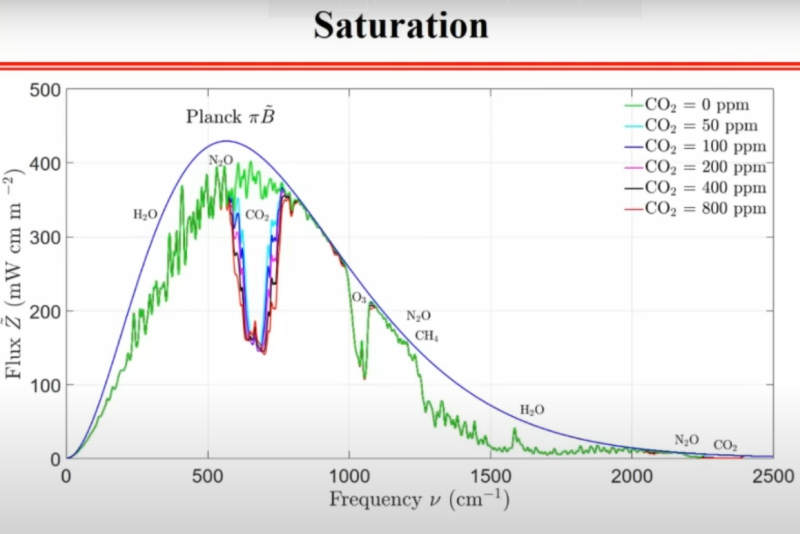
Yes, that seems to be a contradiction, but it is not. CO2 only absorbs a small part of the electromagnetic spectrum, especially radiation in the wavelength band around 15 micrometers. Most of the infrared radiation is not affected by CO2.
In addition, the CO2 greenhouse effect has a logarithmic trajectory. When the concentration of CO2 rises, there is less and less radiation in its bands of the electromagnetic spectrum available to be absorbed. Increasing the concentration of CO2 above a certain value no longer has a measurable effect on temperature. This phenomenon is known as "saturation". The CO2 greenhouse effect was already almost saturated with the CO2 levels present before the Industrial Revolution, so it has never played an important role in the entire period since then. More detailed information on the saturation of the greenhouse effect: Why did the warming stop?
Do you want to know more?
The first part of this article is a summary of
this study. The original article offers much more details on how to reach our conclusion. Before you start reading the text it is useful to know some abbreviations:
- DWLWIR - Downwelling Longwave Inward Radiation
- EALOR - Effective Atmospheric Layer of Outward Radiation (the height at which radiation is more likely to be emitted into space than to return to Earth)
- ToA - Top of Atmosphere
- sfc - surface
Tom van Leeuwen, September 2019.


