Temperature versus CO2 – the big picture
11/28/2018 16:11 - Posted by Tom van Leeuwen
When discussing “Climate Change” it’s good to have an understanding of how the Earth’s climate has changed in the past. That will give us a reference to decide whether the current changes are normal or not.
Global temperatures have varied a lot over the last 500 million years. Depending on the timescale used, the current temperature is either cold or hot, so when you want to know the “normal temperature” you’ll have to indicate what timescale you’re using.
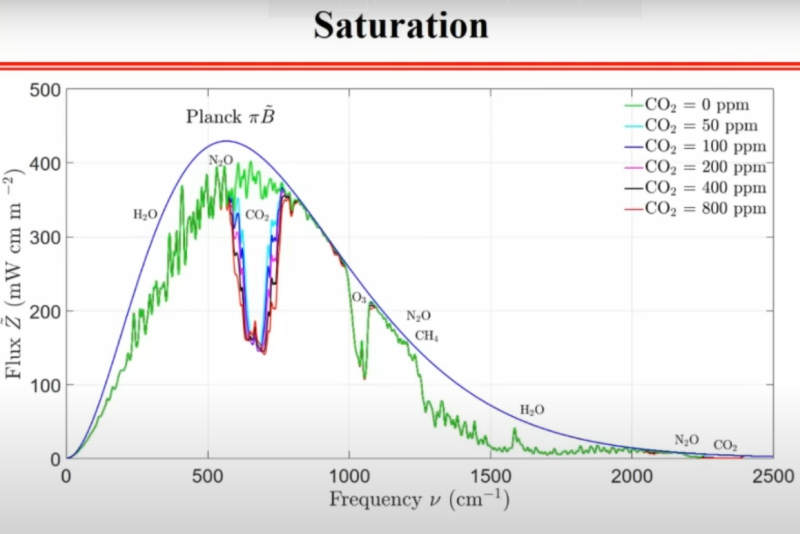
The role of CO
2 has been heavily disputed over the last century. In 1970, scientists were convinced CO
2’s greenhouse effect was already saturated, even at concentrations measured at the beginning of the Industrial Revolution (1850) when CO
2 was at around 300 parts per million. Saturation means that adding more CO
2 has no measurable effect on global temperatures.
Later some climate scientists started to doubt that fact, so it’s important to include CO
2 concentration measurements or proxies in this overview.
The geological timescale – 570 million years
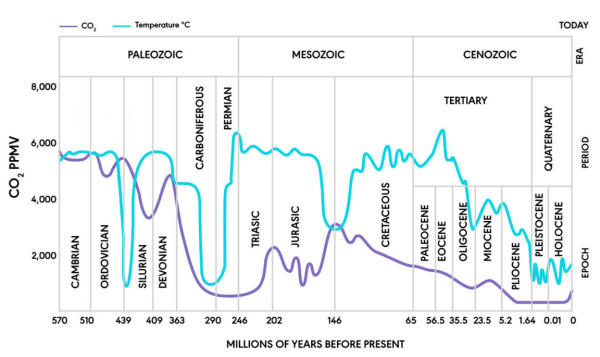
On this timescale, we observe the largest climate fluctuations. Continents were formed and ocean currents changed in the process.
Temperatures were very high, 15 to 20 °C higher than now. During most parts of this period, no sub-zero temperatures were measured anywhere on Earth, so ice-caps were absent.
CO
2 levels were very high, above 5,000 parts per million during most of this period. That’s 12 times the current levels. Live on Earth flourished, the continents were covered with thick woods and in the oceans, coral riffs started to grow. Carbon deposits were created in the form of deep ocean sediments, carbonaceous rocks and fossil fuels like coal, oil and natural gas.
55 Million years ago, with CO2 levels still well above 1,000 ppm, global temperatures started to decline sharply. These CO2 levels are considered extremely dangerous by the IPCC and according to them, those concentrations could cause a runaway warming process. Real-world measurements, however, show us the contrary. Temperatures declined.
This contradicts the CO2 greenhouse gas hypothesis.
It’s very clear that seen on this timescale, both the modern temperatures and CO
2 concentrations are extremely low. There is, however, no clear correlation between temperature and CO
2 levels. Other factors like continent formation, volcanism and ocean currents ruled the climate changes.
The Quaternary timescale – 2.5 million years
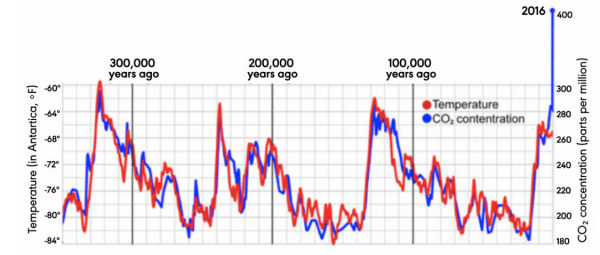
This timescale is marked by the latest and current ice age.
Over 30 glacial periods have been defined in this period. These glacial periods are separated by interglacials, each one of them lasting around 10 thousand years. The Holocene is the current interglacial we’re living in.
In one complete glaciation cycle, worldwide average temperatures fluctuate around 12 °C between the deepest glacial minimum and the warmest interglacial optimum.
Over this whole period of 2.5 million years, both the Earth’s polar regions present permanent land ice. As a result of glaciations, the North Pole ice cap can reach as far south as the current locations of New York and London.
In the figure above, we observe the latest three glacial cycles.
Seen on this timescale, we currently live in a warm period that has enabled humans to develop. However, we observe that the current interglacial is not as warm as the previous ones. Current temperatures are not extreme in a Quaternary context.
During the Quaternary, CO
2 concentration and temperature have tracked closely. That raises the question about causation and effect.
If we follow the “official” greenhouse gas hypothesis, as published in the various IPCC reports, temperature follows CO
2 concentration. So, the relation would be:
Unknown cyclical forcing (???)
CO2 concentration fluctuations
temperature fluctuations
That leaves a big question: What caused the CO
2 concentration to behave this way? What cyclical forcing caused carbon to be released from its natural deposits like deep-sea sediments, carbonaceous rocks, fossil fuel deposits and CO
2 dissolved in seawater?
Do we have evidence for... something like cyclical volcano eruptions, repeating every 100 thousand years? Mysterious cyclical vertical ocean currents that transport carbon-rich sediments to the surface every 100 thousand years? Or Intelligent life appearing every 100 thousand years, burning fossil fuels and then disappear?
No. There seems to be no logical answer to this question.
If we take the CO
2-temperature relation the other way around, we obtain the following line of reasoning:
Milankovitch cycles
temperature fluctuations
CO2 concentration fluctuations
Now everything fits together.
The
Milankovitch cycles are small alterations in Earth’s orbit around the Sun, like the orientation of Earth’s axis (precession), eccentricity and variations in the axial tilt that create cyclical variations in the solar energy input. These external influences result in the cyclical temperature fluctuations known as glacials and interglacials, more or less the same way the Earth’s axial tilt creates the seasons but with a much longer cycle length.
Warm oceans can contain less CO
2. So, when oceans warm, CO
2 from the oceans is released into the atmosphere.
As CO
2 levels are extremely low at the onset of each warming cycle, well below the saturation point of its greenhouse effect, there might be a small positive feedback of CO
2-induced warming that helps the other natural factors to lift the Earth out of each glaciation. But when temperature CO
2-concentration reaches a certain level the warming stops.
We must conclude that CO
2 concentration trails temperature. Temperature fluctuations are the cause, CO
2 level variations are the consequence.
To give the figure some perspective, the modern CO
2 concentration spike is included at the far right side of the graph. It is quite clear that CO
2 levels have exploded over the last 100 years, completely out of sync with natural variation. Most likely this increase is due to human emissions. The carbon that was stored in the form of fossil fuels is released, using its chemical energy for human development: food production, transportation, medicine, and other human welfare enhancements.
Although the CO
2 levels have risen by almost 50%, there is no corresponding spike in worldwide temperatures. More about the Modern Warming Period later in this article.
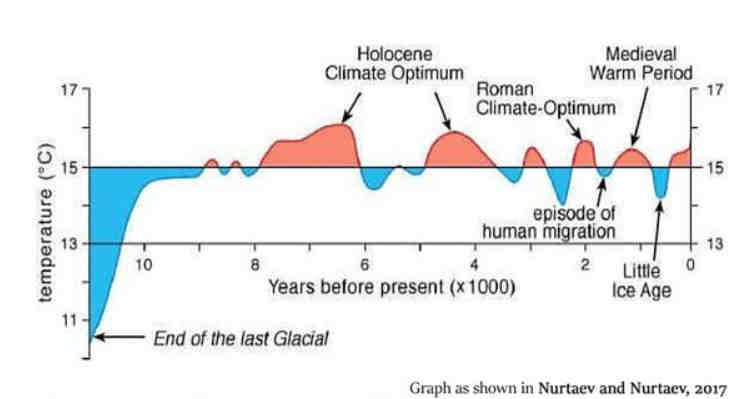
The Holocene timescale – 10 thousand years
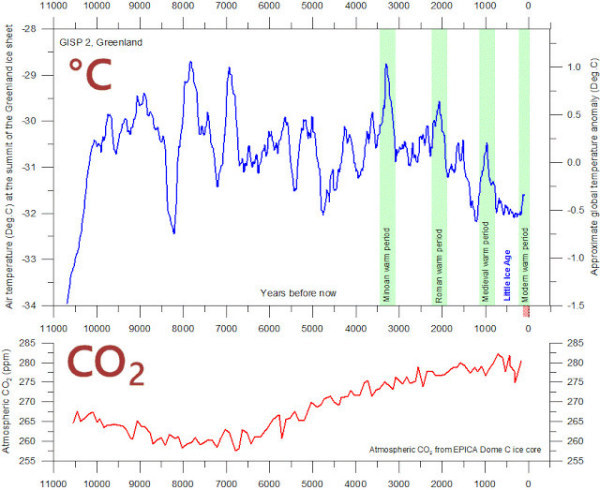
Fifteen thousand years ago, global temperatures started to rise as Earth came out of the latest glacial period.
Welcome to the Holocene!
This interglacial has allowed the human race to develop like never before.
The Holocene Optimum was reached 8 thousand years ago with temperatures around 4 °C higher than today. Since then, temperatures have steadily declined, with some ups and downs like the Minoan Warm Period (3,500 years ago) the Roman Warm Period (2,000 years ago), the Medieval Warm Period (1,000 years ago) and the Little Ice Age that ended 200 years ago.
On this scale, we’re living in a cold period recovering from the extremes of Little Ice Age. Over 90% of the Holocene has been warmer than today.
CO2 levels have been rising over the last 8 thousand years to around 300 parts per million at the end of the Little Ice Age.
So, temperatures fell while CO2 concentration increased. This contradicts any claim that there is a positive correlation between CO2 levels and global temperature.
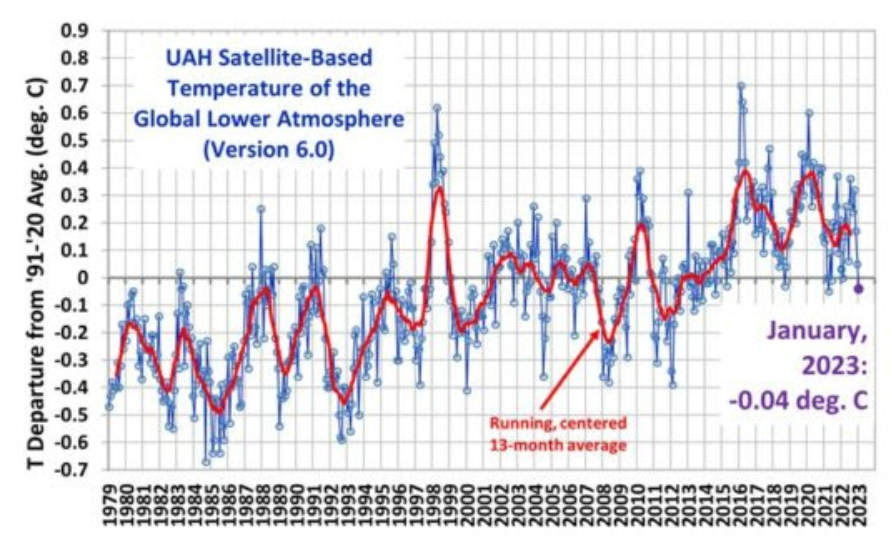
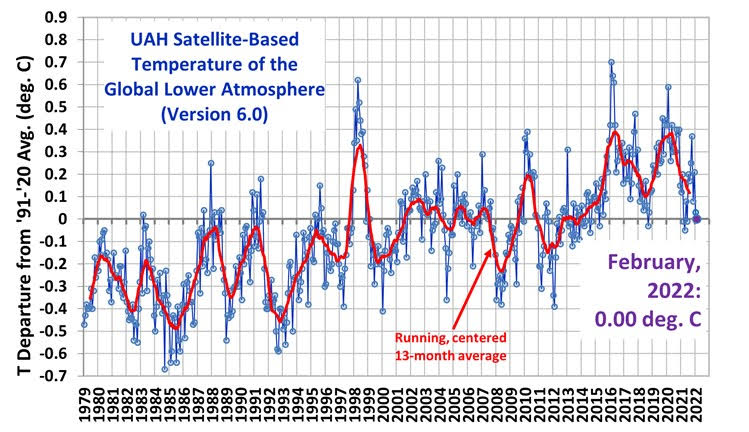
Modern Warming – 200 years
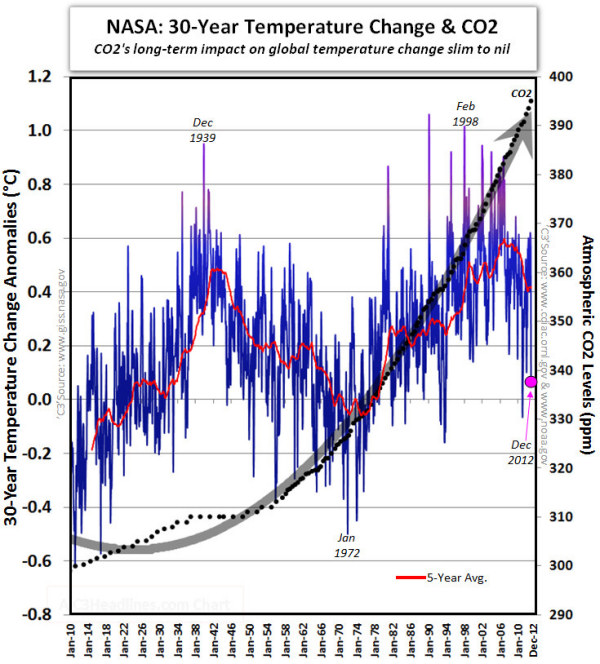
Temperatures are recovering from the coldest period of the Holocene, the Little Ice Age, so there has been some warming over the past 200 years.
There have been intervals with a clear correlation between CO
2 and temperature, but during two periods, from 1940 until 1975 and since 2000 until now, the correlation has been inversed. Rising CO
2 concentrations coupled with falling temperatures.
This is in contradiction with the CO
2-hypothesis.
Conclusions
- Global temperatures are recovering from the coldest period (Little Ice Age) of a warm period (Holocene) within one of the coldest periods (Quaternary) of Earth’s history
- It is not true that we are breaking temperature records. Moreover, we’re much closer to breaking all-time cold records then all-time highs
- It is true that CO2 concentration levels are the highest of the past 2.5 million years
- It is true that rising CO2 levels are due to human carbon emissions
- It is not true that these high CO2 levels are a threat to life on Earth. Life started and thrived at much higher global temperatures and CO2 levels
- It is not true that CO2 concentration fluctuations are the main driver for temperature variation. None of the four timescales we've observed show evidence of a clear positive correlation between CO2 and global temperature.
So
the CO2-hypothesis is contradicted by real-world, empirical observations.
View the facts without prejudice.
Tom van Leeuwen, November 2018.