The "Green Lungs of the Earth" Myth
02/20/2019 12:00 - Posted by Tom van Leeuwen
This must be the environmental myth with the deepest roots of them all (pun intended). It's compulsory subject matter in public schools around the globe, it's passed from generation to generation and if you dare to question it in public, disbelieve, rejection, jeering and even exclusion from the conversation will be your treat. That's the typical way people react when their beliefs and primary "knowledge" are challenged.
The myth:
Woods, forests and jungles are Earth's "Green Lungs" that generate and produce the oxygen we need to breath and live.
It is understood that the woods, forests, and jungles mentioned in this myth have a constant size and weight, they're supposed to generate the oxygen without expanding their extension.
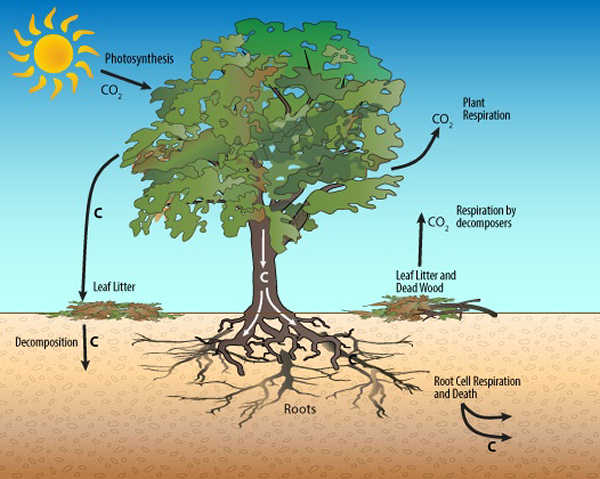
The link between plants and oxygen is closely related to the carbon cycle. When CO
2 is consumed, oxygen is released and vice versa. So, let's take a look at the carbon cycle, as depicted in the image above.
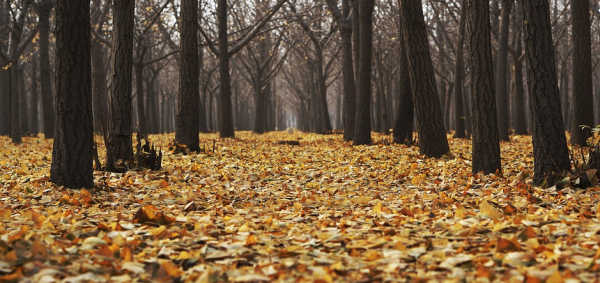
The "Green Lungs" phase of the cycle
Like most myths, this one has some factual background. Plants consume CO
2, water and energy (sunlight) in a process called photosynthesis. This process produces oxygen and carbon compounds (sugars). The oxygen is released into the atmosphere and the carbon compounds are used for the plant to grow.
The problem is that the myth stops here and does not tell the other part of the cycle.
The oxygen consumption phase
Some the oxygen and carbon compounds that were produced during the daylight hours are consumed by
"Plant respiration". This process is opposite to photosynthesis and produces CO
2, water and energy.
Most of the carbon compounds, however, will stay inside the plant and are used for leaf growth or stored in the stem and roots. This way the whole plant grows.
In autumn some plants lose their leaves. Branches will break off and fall down during storms and some plants will die. This produces organic litter that accumulates on the ground. The litter decomposes, consuming oxygen and producing CO
2.
Wildfires will periodically burn parts of the forests. Burning wood consumes oxygen and produces CO
2 and other compounds.
Sooner or later, all plants and trees die. They fall to the ground, decompose and all the carbon compounds that were stored in their stems will decompose, consuming oxygen and producing CO
2.
Although it takes time, even the roots will decay and be decomposed, consuming oxygen through a process called
soil respiration.
Ultimately,
all the oxygen that was initially released into the atmosphere will be consumed by the oxidation processes: plant respiration, decomposition, soil respiration, and (possibly) combustion.
As plants in woods, forests and jungles are in different stages of their lives, all these processes happen at the same time. Some processes, however, depend on the season so we must consider the yearly total in order to include all seasons. Some years our trees might suffer more wildfires than other years, so we have to take the yearly average and conclude that:
The average yearly oxygen balance of wood, forest or jungle with a constant size equals zero.
Moreover:
Contrary to general belief, the only way to obtain a temporary, positive effect on the oxygen balance for existing woods, forests or jungles is to cut them down.
The timber must be treated with chemicals like varnish or paint in order to prevent decomposition. This has only a temporary effect because ultimately, the furniture, houses and other objects that are produced and constructed with the timber will be burned, consumed by insects or otherwise destroyed, ultimately leading to the decomposition of the timber and the corresponding oxygen consumption.
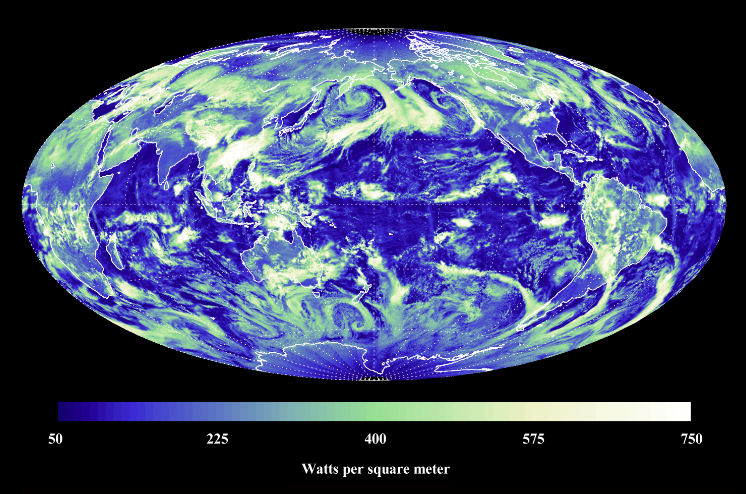
Atmospheric CO2 distribution
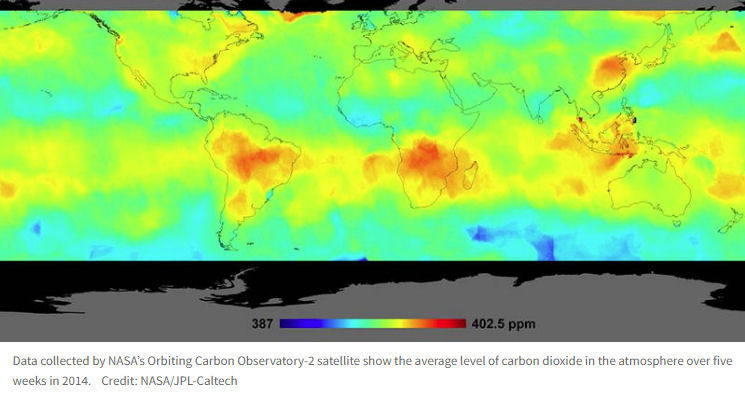 The CO2-concentration
 is higher in the regions with mature tropical rainforests, where emissions from decaying organic material are higher than the amount of CO
2 consumed by growing plants
The oxygen cycle
If the oxygen we breath does not come from the natural woods, forests and jungles, then
where does it come from?
It's true that the Earth's
oxygen cycle is based on photosynthesis, but the surplus that is used for human consumption and fossil fuel combustion comes from the oceans. In fact, almost half of the Earth's photosynthesis takes place in the oceans and it is known that the
small marine bacteria "Prochlorococcus" is responsible for almost 25% of all photosynthesis on Earth.
Now that the myth is busted, let's take a look at some solutions that do have a positive effect on the local or global oxygen balance.
Local "Green Lungs"
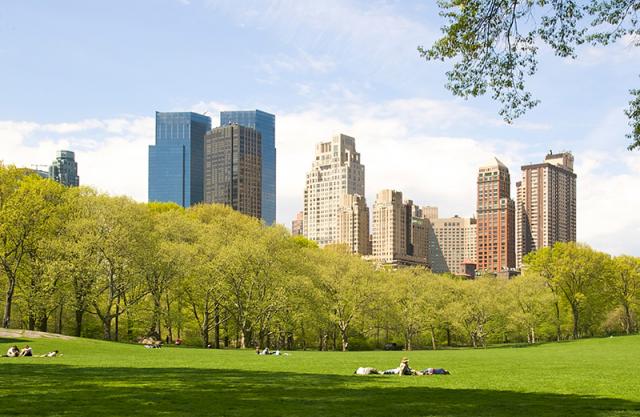
There is a way to create an artificial, local "Green Lungs" effect if the two parts of the carbon cycle take place at different locations. For example, consider a well-maintained city park or trees planted alongside city streets. The photosynthesis phase takes place within the city boundaries while all litter (leaves, branches) is collected and taken out of the city for decomposition. That's where the oxygen consumption phase takes place. In this case, the city parks and trees will help to compensate for the additional oxygen consumption caused by the city traffic and the respiration of population concentrations.
Planting more trees
Initially, planting more trees and creating more woods has a positive effect on the oxygen balance. During the first years of their lives, the oxygen-producing "Green Lungs" photosynthesis phase of the carbon cycle is more important than the oxygen consumption phase. When the wood matures and the growth slows or stops, oxygen consumption will eventually equal the oxygen production and the positive effect ends. That's the moment to check if the trees have enough natural offspring. If not, the process will revert and the oxygen balance will turn negative, ultimately wiping out all the positive results we initially obtained.
Taking care of our natural environment
Although the conception that jungles, forests, and woods are Earth's "Green Lungs" is false, there are other reasons to preserve and take care of the Earth's natural environments, reasons like bio-diversity and beautiful scenery. But that, of course, is no excuse at all to justify spreading half-truths, myths and propaganda or even worse, the intentional indoctrination of children during their education at public or private schools.
Tom van Leeuwen, February 2019.