Glacier Logic


02/19/2019 16:30 - Posted by Tom van Leeuwen
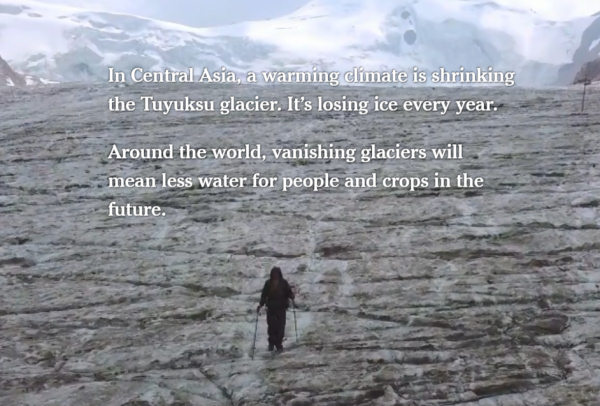
Last month, the New York Times website published a page titled "Glaciers Are Retreating. Millions Rely on Their Water." It shows a dramatic image, zooming out of a person walking down a dry glacier bed with the following text:

"In Central Asia, a warming climate is shrinking the Tuyuksu glacier. It’s losing ice every year.

Around the world, vanishing glaciers will mean less water for people and crops in the future."

This time, we won't dive into the question of whether glaciers are shrinking or growing. It's clear that glaciers are dynamic systems and that the climate that surrounds them always changes. Some will shrink while others might grow.

What the NYT is trying to make us believe is one of the most persistent myths about climate and Global Warming.

Myth:

"Shrinking glaciers mean future generations will have less water available."

Analyzing the myth

Water that's been frozen into a glacier can't be used by people. It first has to melt and flow down the mountain in order to be used. So, the very process that makes glacier water available will make the glacier disappear!

This myth makes you fear something that at the same time is what you desire to happen. You fear that the glacier disappears and at the same time you desire the glacier to disappear because you want the water to be available for people and crops. This is a perfect example of the classic saying: "you can't have your cake and eat it."

The only valid relation between glacier size and water availability is the larger the glacier, the less water available because the water that's frozen into the glacier is not available. So, that turns the myth around!

Water availability depends on the amount of precipitation. Not on the glacier size! Glaciers only form a buffer that retains or releases water into the valleys according to the glacier temperature.

Myth busted!

Tom van Leeuwen, February 2019.


Please donate

Fighting the climate hysteria is time-consuming! If you think I'm on the right track and you want to support my efforts I would be more than happy to receive a small donation that will help me to maintain this site.

Thanks!


The fingerprints of the greenhouse effect

The hypothesis of "man-made climate change" tells us that the increase in the concentration of CO2 enhances the greenhouse effect of the atmosphere and has global warming as a final result.

Since the beginning of the industrialized era around 1850, man emits relatively large amounts of CO2 into the atmosphere through the use of fossil fuels. The consequence of these emissions is that during that period, the concentration of CO2 in the atmosphere increased sharply from about 300 parts per million to more than 400 ppm, an increase of almost 40%. The average temperature increased in the same period more or less 1.5 °C with a small variation depending on the data source used.
Read more...

Why did the warming stop?

The political reports of the IPCC are based on the hypothesis that CO2 is the most important control knob of the Earth's temperature. The problem is that this hypothesis does not correspond at all with the empirical data available to science. Forecasts are made using models that are not capable of 'predicting' the past.
Read more...

Temperature versus CO2 – the big picture

When discussing “Climate Change” it’s good to have an understanding of how the Earth’s climate has changed in the past. That will give us a reference to decide whether the current changes are normal or not.

Global temperatures have varied a lot over the last 500 million years. Depending on the timescale used, the current temperature is either cold or hot, so when you want to know the “normal temperature” you’ll have to indicate what timescale you’re using.
Read more...

Dutch Warming

In the Netherlands, the day-to-day whether depends heavily on the direction the wind is coming from. Being a small country, the wind direction is quite homogeneous for the whole country, specially on higher altitudes where the bulk of heat convection is taking place.

Due to its geographical position, midway between the icy-cold Arctic to the north, the dry and hot Sahara to the south, the Eurasian land-mass to the east and the Atlantic Ocean to the west, every wind direction comes with unique weather characteristics.

North - cold,
East - dry,
South - warm,
West - wet whether.
Read more...

Satellite temperature observations

This month of January 2023, the average satellite temperature published, by Dr. Christy and Dr. Spencer (University Alabama Huntsfield) had a negative deviation, compared with the average monthly measures between 1991 and 2000.

Of course, this value does not mean much, it's definition is full of arbitrary begin and endpoints, but anyway it doesn't sound like a lot of warming has taken place over the past 30 years, and even less "catastrophic warming" we're reading about in the Mainstream Media, newspapers and TV stations.
Read more...

CO2 saturation

This graph is all you need to understand that CO2 is not the Earth's Climate Control Knob.

On the horizontal axis, we see the Infra-red (IR) spectrum wavelengths, that is like "IR colors" were this kind of radiation visible to the human eye.
The vertical axis shows to energy flux, that is the energy emitted by the Earth, as seen from outer space.

The graph itself shows how the Earth's atmosphere filters the IR radiation emitted by the Earth's surface and the role of the various greenhouse gases in that filtering process. The green line is the filter of the Earth's atmosphere without any greenhouse gases.
Read more...

Video - Who are the real climate deniers?

The climate has shown many fluctuations during the Holocene. The difference between the highest and lowest average temperature of the past 10 thousand years is about 3 °C.

Climate alarmists, led by the IPCC, are trying to deny this, and understandably so. This variation means that without human influence there was climate change as well.

This undermines their hypotheses and often their jobs depend on it.

Climate change seen from a historical perspective.
Read more...

Satellite Earth temperature February 2022

The satellite temperature departure measurement for February 2022 is exactly 0° C.

This means that Earth temperature during February 2022 was exactly the same as the average from 1991 to 2020.

Satellites are the best way to have insight into the short-term temperature variations. They measure the whole surface, independent of weather station distribution, Heat Islands, measurement failures, surface condition (land or water).

There is a step-wise increase in temperature, triggered by two very strong El Niño events (1998 and 2016.) The energy that welled up from the deep oceans established a new level in these two ocasions, where the warming paused. This is a natural phenomenon and has nothing to do with CO2, or human activity.

Where is the Climate Emergency? It just does not exist.

Wake up and spread this information to your government!

Tom van Leeuwen, March 1st, 2022.